
Data: MLS PIN, single-family homes, July 1 to September 30 in 2025 and 2026. Covers Quincy, Weymouth, Holbrook, Rockland, Hull, Halifax, Plymouth, Bridgewater, East Bridgewater and West Bridgewater, with Massachusetts statewide for comparison. Compiled by Bluefin Property Buyers, October 2026.
Every month we publish separate market reports for ten South Shore and Plymouth County towns plus Massachusetts as a whole. Monthly numbers are useful, but in small towns they are noisy. A quarter smooths that out, and comparing this year’s third quarter with last year’s tells you more about direction than any single month can.
This quarter has an extra reason to matter. July, August and September 2026 were the last three months of closings driven by mortgage rates near 6.5%. On October 1, Freddie Mac’s weekly survey put the 30-year fixed rate at 7.28%, up from 6.34% a year earlier. Q3 2026 is the benchmark every fall and winter number will be measured against.
The scoreboard
| Market | Q3 2026 sales | vs. Q3 2025 | Q3 2026 avg. price | vs. Q3 2025 | Sale-to-list | Listings, Sept 30 (vs. 2025) |
| Plymouth | 253 | +25.9% | $788,653 | +3.2% | 100.00% | 162 (+29%) |
| Weymouth | 125 | +1.6% | $705,764 | +7.5% | 103.74% | 50 (+14%) |
| Quincy | 106 | −9.4% | $810,653 | +8.6% | 100.95% | 50 (+16%) |
| Bridgewater | 60 | +20.0% | $657,523 | −2.5% | 101.32% | 35 (+9%) |
| Halifax | 38 | +100.0% | $624,637 | +1.1% | 100.71% | 5 (−44%) |
| Rockland | 36 | −5.3% | $590,767 | −1.0% | 102.59% | 25 (+92%) |
| East Bridgewater | 32 | +6.7% | $633,031 | −2.0% | 100.49% | 20 (+33%) |
| Hull | 30 | −3.2% | $1,017,158 | +13.6% | 96.76% | 28 (−15%) |
| Holbrook | 27 | −27.0% | $596,693 | +2.9% | 100.50% | 17 (+42%) |
| West Bridgewater | 16 | −5.9% | $814,282 | +37.4% | 100.21% | 11 (+38%) |
| Massachusetts | 11,984 | +2.1% | $881,238 | +1.5% | 100.30% | 8,495 (+27%) |
Average prices are weighted by sales across the three months. Sale-to-list is total sale dollars divided by total list dollars for the quarter.
Finding 1: the South Shore outran the state
Combined, the ten towns closed 723 single-family sales in Q3 2026, up 9.0% from 663 in Q3 2025. Massachusetts as a whole grew 2.1%. The combined average sale price across the ten towns rose 5.3%, from $706,557 to $744,184, against 1.5% statewide.
The region is still cheaper than the state, by about $137,000 on the average sale, and that gap is a big part of why it is outperforming. Buyers who cannot reach the statewide average of $881,238 are finding houses in Plymouth County and the southern edge of Norfolk County they can afford.
Finding 2: price and volume split the towns into four groups
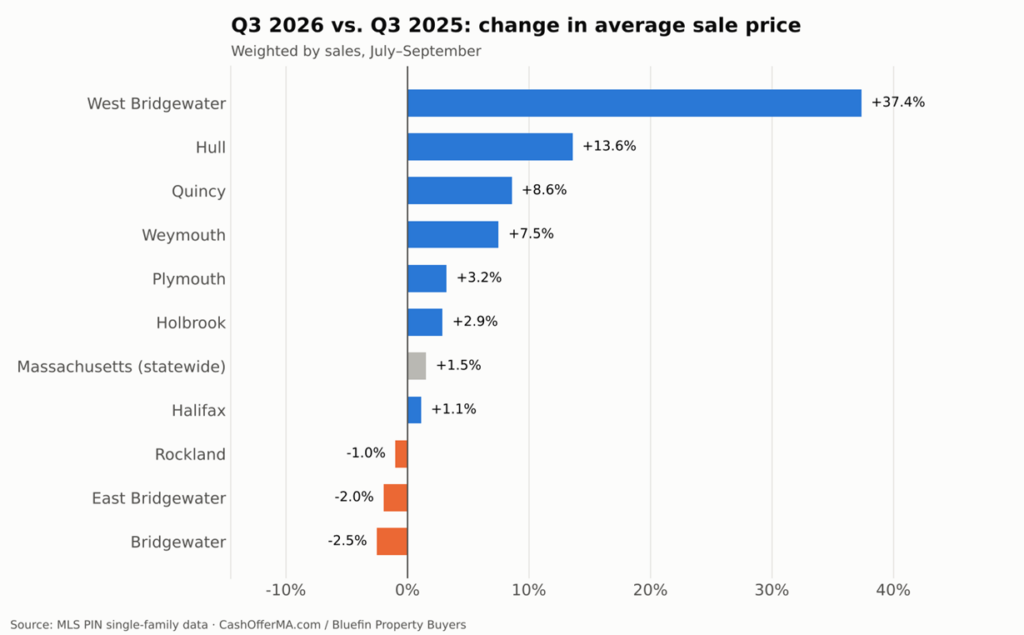
Caption: Six of ten towns beat the state’s 1.5% price gain. Three saw prices slip.
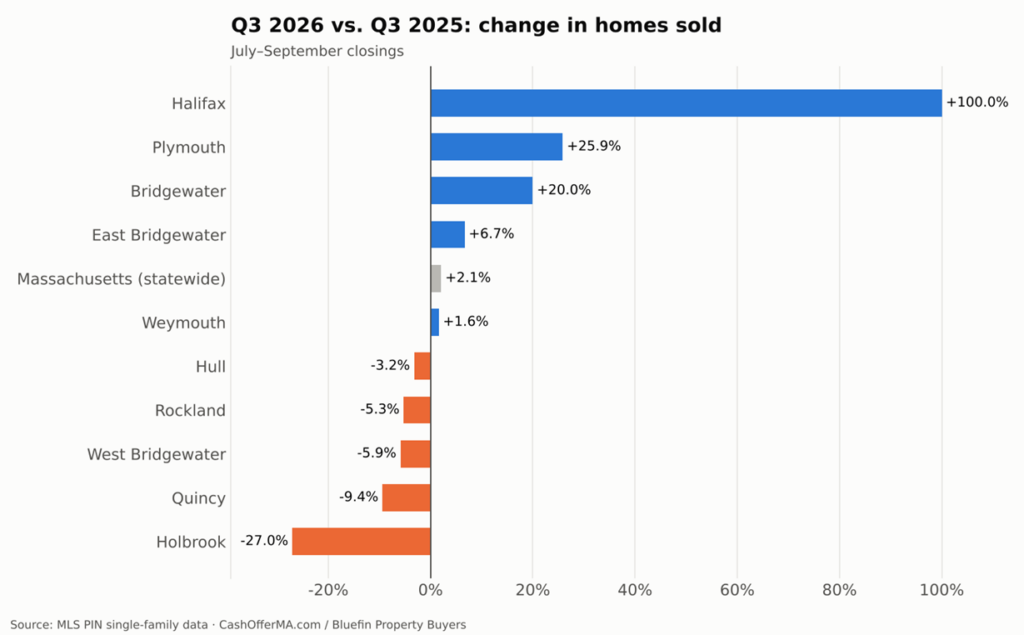
Caption: Volume growth was concentrated in Halifax, Plymouth and Bridgewater.
Set those two charts side by side and the towns sort cleanly.
More sales and higher prices: Plymouth, Weymouth, Halifax. The healthiest combination. Plymouth had the biggest quarter in our data. Weymouth gave sellers their best sale-to-list ratio since 2024. Halifax doubled its sales and nearly sold out of inventory.
More sales, softer prices: Bridgewater, East Bridgewater. Buyers showed up in force but leaned toward the more affordable end of each town. Bridgewater still sold over asking. East Bridgewater saw its unusual gap between asking and sale prices start to close.
Fewer sales, higher prices: Quincy, Hull, Holbrook, West Bridgewater. The supply-constrained or mix-driven markets. Quincy rose 8.6% and staged a strong September comeback. Hull held above $1 million for a second straight quarter. West Bridgewater posted the biggest price gain on just 16 sales. Holbrook had the steepest volume drop in the region.
Fewer sales, lower prices: Rockland. Only modestly on both counts, and with buyers still paying 102.59% of asking. But Rockland also saw its listings nearly double, and its over-asking streak broke in September.
Finding 3: inventory is rising almost everywhere
Eight of the ten towns ended September with more homes for sale than a year earlier. Combined, the ten towns had 403 active single-family listings on September 30, up 20% from 335. Rockland (+92%), West Bridgewater (+38%), Holbrook (+42%) and East Bridgewater (+33%) led the increase. Statewide, listings rose 27% to 8,495, the highest count in our data.
The two exceptions say something too. Halifax had five listings left after selling 30 homes in August and September. Hull had 28, down from 33, as its slow coastal market finally started clearing its backlog.
Finding 4: September looked different from the quarter
The quarterly numbers are strong. The final month of the quarter was noticeably softer, in ways that line up with buyers starting to feel rate pressure.
- In September, homes sold below asking price on average in six of the ten towns: Hull, Holbrook, East Bridgewater, Rockland, West Bridgewater and Plymouth. Statewide, the ratio fell below 100% for the first time since March.
- Several towns that had been the strongest sellers’ markets posted their weakest month of the summer: Weymouth’s ratio fell from 104.01% to 101.89%, and Rockland’s from 103.47% to 98.65%.
- Listings jumped in a single month in Weymouth (34 to 50), Plymouth (123 to 162), Rockland (16 to 25) and East Bridgewater (12 to 20).
Several of our August headlines did not survive September. Rockland’s streak, Holbrook’s record price and East Bridgewater’s $270,000 gap all reversed or narrowed. Quincy went the other way, with a 40-sale September after eight months of declines. That is the case for reading quarters, not months, and for reading the town reports together.
What the rate jump means for Q4
Most of the 723 sales in this report were negotiated with financing near 6.5%. A buyer who qualified for the region’s Q3 average of $744,184 at that rate can afford about $688,000 at 7.28% for the same monthly payment. That buyer has not disappeared, but their budget has dropped by roughly one price band.
The towns most exposed are the ones where buyers stretch the most: the more affordable markets like Holbrook and Rockland, where first-time buyers and FHA borrowers dominate, and the towns with the most new supply to absorb, like Plymouth. The least exposed are those with deep cash-buyer pools, like Hull, and the markets that are simply out of homes to sell, like Halifax.
What this means for South Shore homeowners
For a well-kept home priced to the market, Q3 2026 says the open market still works across the South Shore, and for the first time in years there are many competing listings to measure against.
For homes that need work, the picture going into winter is harder. Inventory is up 20% across these ten towns, buyers’ budgets just shrank, and the listings buyers skip first are the ones with condition problems: outdated systems, failed septic, deferred maintenance, storm damage or unrepaired fire and smoke damage. We wrote about those sellers’ options in why so many Massachusetts houses aren’t selling this fall.
Bluefin Property Buyers is a Massachusetts cash home buyer that purchases houses and condos across the South Shore, Plymouth County and Greater Boston, including every town in this report. We buy as-is, for cash, with no repairs, no commission, no showings and no mortgage contingency, so rising rates do not change our ability to close. We renovate the homes we buy ourselves, which is how we can make a firm offer on a property other buyers will not touch. When you want to know what your house is worth without the listing process, start with Bluefin Property Buyers.
Take the easy way out.
Frequently Asked Questions
How did the South Shore housing market perform in Q3 2026?
Ten South Shore and Plymouth County towns closed 723 single-family sales in Q3 2026, up 9.0% from Q3 2025, and the combined average sale price rose 5.3% to $744,184. Both figures outpaced Massachusetts, where sales rose 2.1% and prices rose 1.5%.
Which South Shore town had the biggest price increase in Q3 2026?
West Bridgewater’s average sale price rose 37.4% to $814,282, though on only 16 sales and driven largely by a shift toward larger homes. Hull (+13.6%), Quincy (+8.6%) and Weymouth (+7.5%) followed.
Where are home prices falling on the South Shore?
Bridgewater (−2.5%), East Bridgewater (−2.0%) and Rockland (−1.0%) had lower Q3 2026 average sale prices than in Q3 2025. In all three, buyers still paid at or above asking price on average.
Is inventory increasing on the South Shore?
Yes. Eight of ten towns had more single-family homes for sale at the end of September 2026 than a year earlier, and combined listings were up 20%. Halifax and Hull were the exceptions.
How will 7% mortgage rates affect South Shore home sales?
Q3 2026 sales were mostly negotiated with rates near 6.5%. At 7.28%, the same monthly payment buys about 7.6% less house, which is likely to slow sales and pressure prices most in affordable, first-time-buyer towns and in markets with the most new inventory.