
In August, the best statistic in Bridgewater’s report was how fast it had cleared its backlog. Unsold listings had gone from sitting an average of 93 days in December 2025 to just 30 days. Months of inventory was 1.58, tighter than the state.
Two months later, the backlog is back, and it is bigger than anything in our record.
Bridgewater had 51 single-family homes for sale at the end of October 2026. That is up from 35 in September, 32 in August, and 23 in October 2025. It is a 46% jump in a single month and more than double last year’s level.
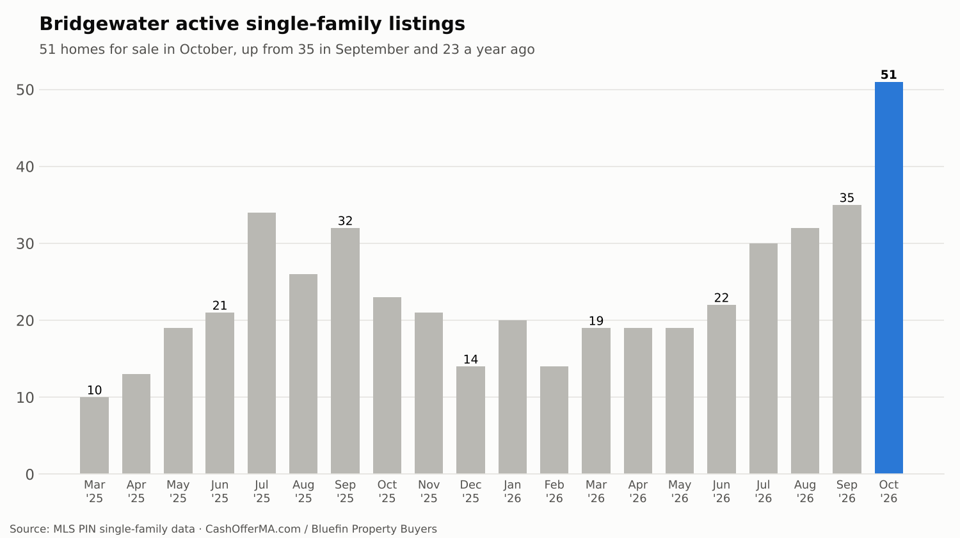
Caption: Sixteen net new listings in one month.
From tight to loose in two months
With 13 sales in October, those 51 listings add up to 2.79 months of inventory, the most in our Bridgewater record. In August it was 1.58.
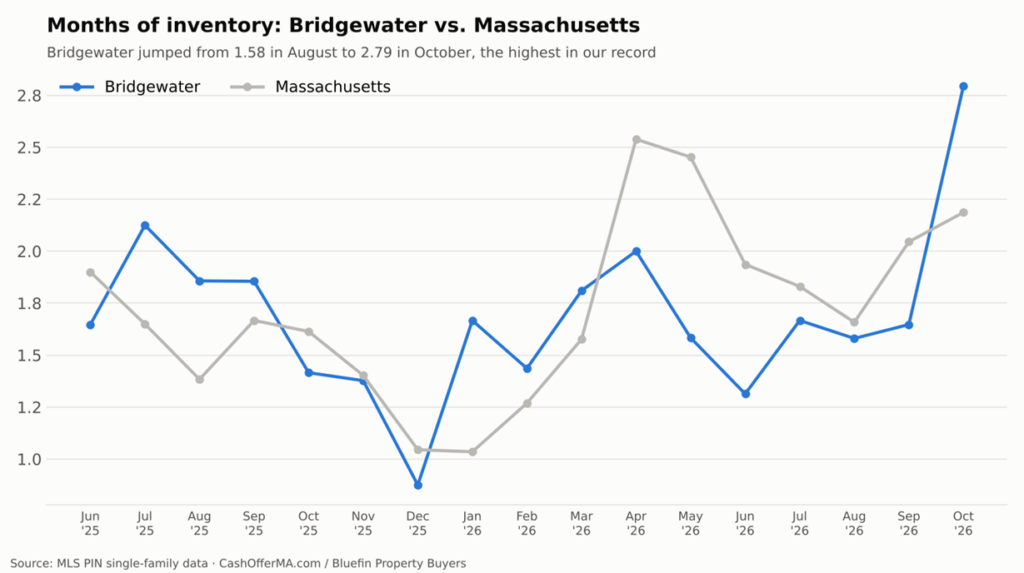
Caption: Bridgewater moved above the statewide level for the first time since spring.
The rest of October fits a market tipping toward buyers:
- 13 sales, down from 15 in October 2025 and 20 in September.
- 99.37% of asking, compared with 102.73% a year ago.
- Average price $647,269, down 5.1% from $681,957.
- Homes that sold took 39 days, faster than last October’s 51. The houses that are right are still moving.
Where are the new listings coming from?
The data does not say who is listing, but the pattern is familiar. Bridgewater has a deep stock of homes owned by people who are not living in them: rentals near Bridgewater State University, inherited houses, and properties owners bought as investments over the past decade. When the summer market was hot, many of those owners considered selling. Fall is when they actually list, and rates above 7% mean fewer buyers are waiting for them.
The three-month view puts it in perspective. From August through October, Bridgewater closed 51 sales, slightly more than the 47 a year earlier, but at an average of $651,039, down 3.7%. Demand has held up. Supply has outgrown it.
Our September Bridgewater report covers the busy Q3 that came before this, and our Q3 South Shore roundup compares Bridgewater with its neighbors.
Selling a Bridgewater house with 50 others on the market
Updated homes priced near the market are still selling in under six weeks. The problem is the rest of the 51.
A buyer comparing Bridgewater listings this winter will skip the former student rental with worn floors and a patched bathroom, the 1960s ranch with the original electrical panel, and anything with a burned-out kitchen or other damage the owner never got around to repairing. Those houses tend to sit, take price cuts, and sit again. For an absentee owner or an estate, every month adds taxes, insurance and the risk of a vacant house in winter.
Bluefin Property Buyers buys Bridgewater homes for cash, as-is, including tenant-occupied rentals and properties with fire, water or structural damage. We are a Massachusetts real estate company that does its own renovations, so there are no repairs for you to make, no commission, and no buyer’s mortgage that can fall through. See how our process works, then ask Bluefin Property Buyers for your cash offer.
Take the easy way out.
Data: MLS PIN, single-family homes, Bridgewater, through October 31, 2026.
Frequently Asked Questions
How many homes are for sale in Bridgewater MA right now?
Bridgewater had 51 active single-family listings at the end of October 2026, up from 35 in September and 23 a year earlier. It is the most in our 20-month record.
Is Bridgewater becoming a buyer’s market?
It is moving that way. Months of inventory reached 2.79 in October 2026, up from 1.58 in August and above the statewide 2.19, and homes sold for 99.37% of asking.
What is the average sale price in Bridgewater?
October 2026 sales averaged $647,269, down 5.1% from October 2025. The August–October average was $651,039, down 3.7%.
How long does it take to sell a house in Bridgewater?
Homes that sold in October 2026 averaged 39 days on market, faster than 51 days in October 2025. Properties needing work typically take longer.
Can I sell a Bridgewater rental property or a house with fire damage for cash?
Yes. Bluefin Property Buyers purchases Bridgewater rentals, including student rentals with tenants in place, and homes with fire or water damage, for cash and as-is.