
Plymouth’s October had a split personality.
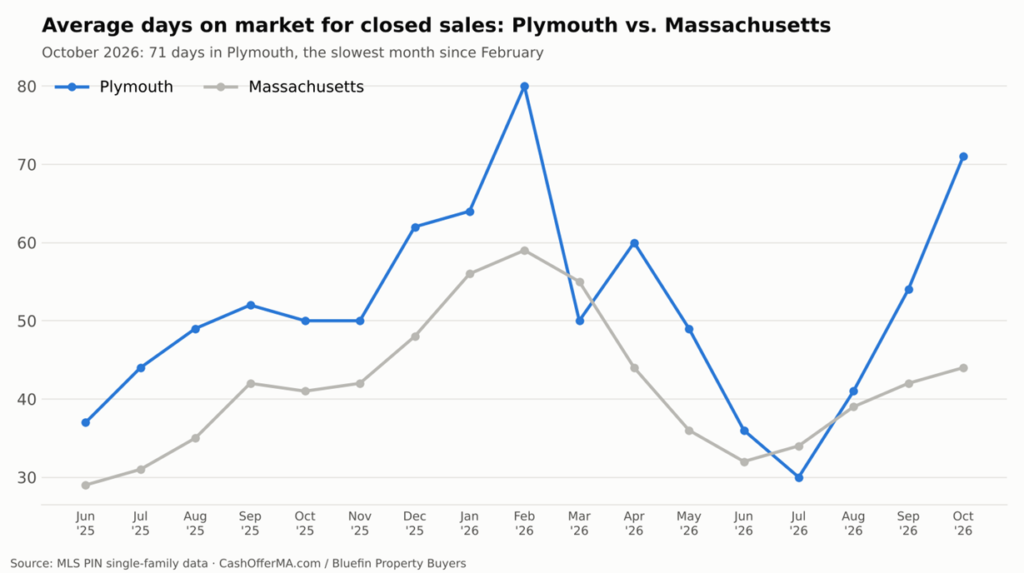
On one side: homes that sold in October took an average of 71 days to get there. That is the slowest month since February, up from 54 in September and 30 in July, and well above the statewide average of 44.
On the other side: they sold for an average of $852,350, up 10.8% from $769,570 in October 2025 and the third-highest monthly average in our 20-month Plymouth record.
Slower, and more expensive. Here is how both can be true.
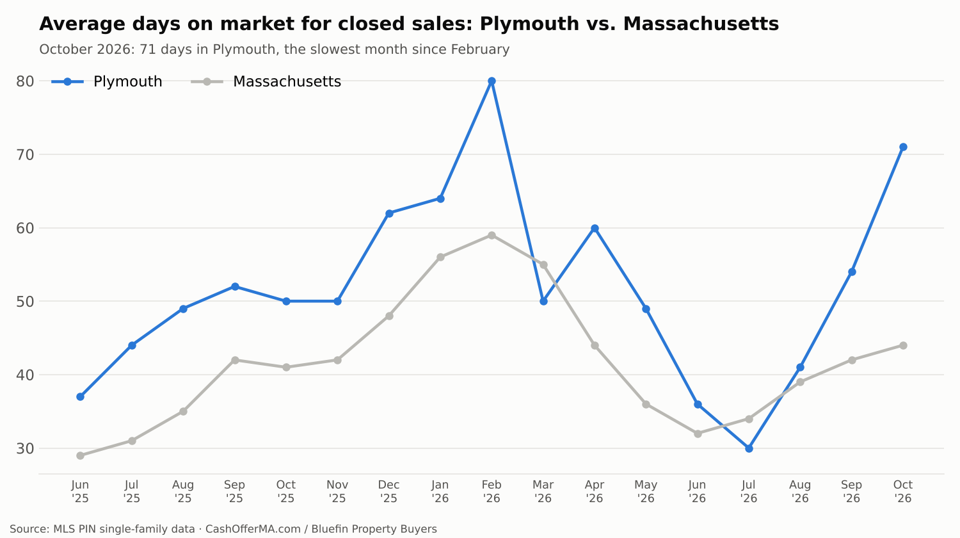
Caption: Plymouth’s selling time more than doubled between July and October.
Who is buying in Plymouth this fall
Plymouth is the largest town by area in Massachusetts, and its market is just as varied. It takes in North Plymouth’s older neighborhoods, Manomet and White Horse Beach cottages, the newer communities at The Pinehills, and waterfront along Plymouth Bay and Cape Cod Bay. Its sales mix can shift a lot from month to month.
In October, the shift was toward higher-priced homes. Those take longer to sell, and they are bought by people less exposed to mortgage rates: retirees moving with equity from a larger house, second-home buyers, and buyers paying cash. That would explain both a 71-day average and a higher price.
Plymouth’s volume held up as well. The town closed 69 sales in October, almost exactly the 70 of a year earlier, and 232 from August through October, up 13.2%. With 591 sales so far in 2026, it remains by far the busiest market we cover.
The record nobody wants
Plymouth had 178 single-family homes for sale at the end of October, the most in our record, up from 162 in September and 116 a year ago. That is a 53% increase in a year.
Caption: Plymouth’s listings have set a new high two months in a row.
Months of inventory rose to 2.21, from 1.97 in September. Homes sold for 99.67% of asking. And the average asking price on active listings fell to $897,322, the lowest in our record, which tells you sellers are starting to price for a slower market.
The pattern is the one we described last month: Plymouth’s buyers are absorbing a lot of homes, but new listings keep arriving faster. Heading into winter, that is a lot of competition for every seller in town.
Our September Plymouth report covers the record quarter that set this up.
Selling in Plymouth this winter
If your home is the kind Plymouth’s fall buyers want, the price data is encouraging. But it may take two months or more to find that buyer, and you will be one of 178 sellers trying.
For houses that need work, the math is harder. A seasonal cottage near the beach that was never insulated, a 1970s ranch with an original septic system, a house damaged by fire or by a winter pipe burst — those are the listings that sit in a 178-home market, especially in November and December, when the second-home buyers have gone until spring. Owners who try to fix them first often find out what renovation really costs: contractors who are booked for months, permits, and budgets that keep growing once the walls come open.
Bluefin Property Buyers buys Plymouth homes for cash, as-is, all year round. We are a Massachusetts company that does its own renovation work, so cottages, damaged houses, estates and rentals are all things we buy without repairs, cleanouts or commission, and we can close in the middle of winter if you need to. See how our process works, then ask Bluefin Property Buyers for your number.
Take the easy way out.
Data: MLS PIN, single-family homes, Plymouth, through October 31, 2026.
Frequently Asked Questions
How long does it take to sell a house in Plymouth MA right now?
Homes that sold in October 2026 averaged 71 days on market, the slowest month since February and up from 30 days in July. The statewide average was 44 days.
What is the average home price in Plymouth in October 2026?
Plymouth’s average single-family sale was $852,350 in October 2026, up 10.8% from $769,570 a year earlier and the third-highest month in our 20-month record.
How many homes are for sale in Plymouth?
Plymouth had 178 active single-family listings at the end of October 2026, the most in our record and up 53% from 116 in October 2025. Months of inventory was 2.21.
How many homes have sold in Plymouth in 2026?
Plymouth closed 591 single-family sales from January through October 2026, including 69 in October, the most of any market we cover.
Can I sell a fire-damaged or seasonal home in Plymouth for cash?
Yes. Bluefin Property Buyers purchases Plymouth homes with fire or water damage, seasonal cottages and vacant properties for cash, as-is, and can close in any season.