
In July 2026, the average Weymouth home sold for 105.05% of its asking price. On a $700,000 list price, that is $35,000 over. It was one of the hottest months for Weymouth sellers in our records, which go back to early 2023.
Here is what happened next:
| Month | Sale-to-list ratio | Homes sold | Active listings |
| July 2026 | 105.05% | 49 | 31 |
| August 2026 | 104.01% | 36 | 34 |
| September 2026 | 101.89% | 40 | 50 |
| October 2026 | 99.94% | 22 | 65 |
Three months, five points of negotiating power, gone. In October, Weymouth homes sold just under list price for the first time since January.
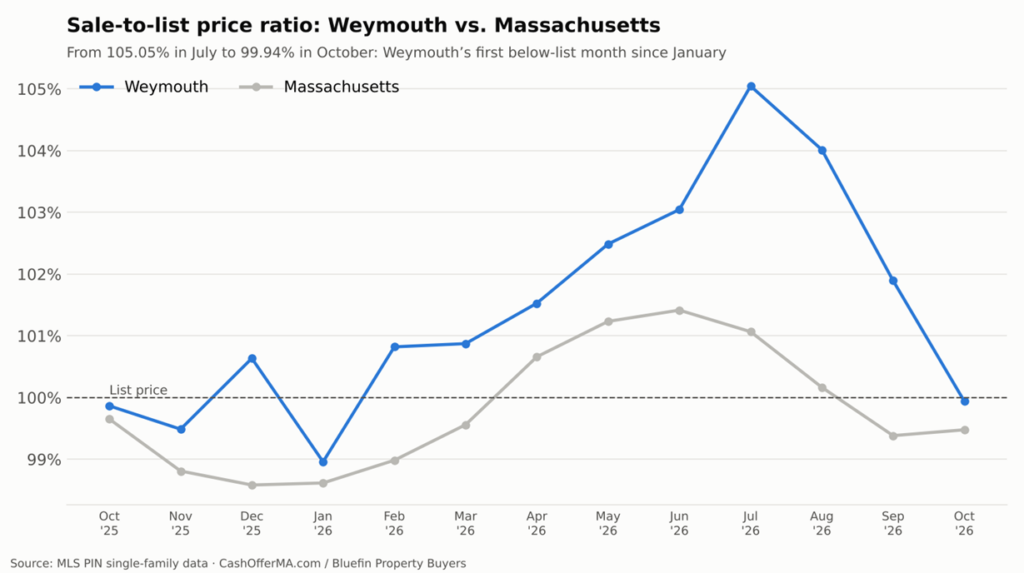
Caption: Weymouth’s over-asking premium unwound over three months.
The September crack became an October turn
Last month we called September “the first crack” in Weymouth: listings jumped and the over-asking premium shrank. October confirmed the direction.
- Sales fell 41%. Weymouth closed 22 single-family homes in October, against 37 in October 2025. It was the fewest in any month since March, and the steepest year-over-year drop among Weymouth’s large-volume neighbors.
- Listings hit a new high. Weymouth had 65 homes for sale at the end of October, up from 50 in September and 45 a year ago, and the most in our records, which go back to early 2023.
- Homes sat longer. October sales took 47 days, up from 29 a year ago and the slowest month since March.
- Months of inventory rose to 1.77, the highest since April.
The average sale price, $658,955, was down 3.5% year over year and the lowest monthly figure since January.
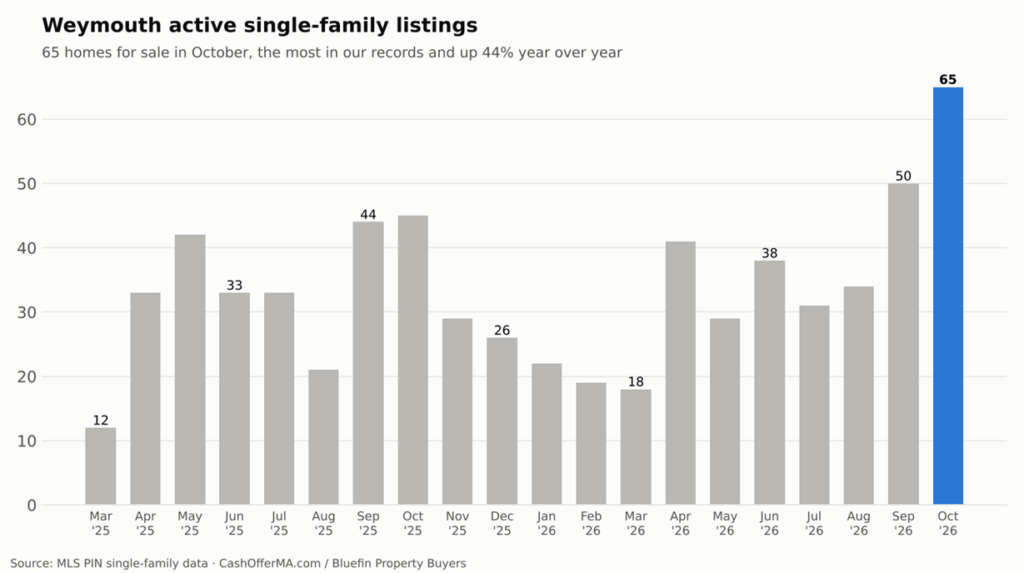
Caption: Sixty-five listings, up from 34 at the end of August.
Why Weymouth turned faster than most
Weymouth’s summer strength came from one kind of buyer: someone priced out of Quincy, Braintree and Hingham, looking for a postwar cape or colonial they could afford near the Red Line and Route 3. That buyer is usually financing most of the purchase, often with less than 20% down. When rates moved from about 6.5% in the summer to above 7% in October, that buyer’s budget fell by roughly 7%, and the bidding wars stopped.
The rest of the picture is still healthy by normal standards. Over the full year Weymouth has closed 300 single-family homes, and from August through October buyers still paid an average of 102.23% of asking. The town is not in trouble. It has gone from an extreme seller’s market to a normal one in a single season.
For the run-up, see our September Weymouth report. We wrote more about what to do when a listing stalls in why so many Massachusetts houses aren’t selling this fall.
What it means if you’re selling in Weymouth now
The summer playbook — list on Thursday, collect offers over the weekend, take the one with no contingencies — is over for now. With 65 competing listings, buyers will compare, inspect and negotiate.
That hits hardest for houses that need work. Weymouth has a lot of them: original 1950s capes in North and South Weymouth, ranches with old oil systems around Lovell’s Corner, houses with decades of deferred maintenance near Weymouth Landing. In July, a buyer would overlook a tired kitchen to win the house. In November, they will just buy the house down the street.
Bluefin Property Buyers buys Weymouth houses for cash, as they are. We are a Massachusetts real estate company that renovates and resells homes across the South Shore, so condition is something we price in rather than a reason to walk away. No repairs, no showings, no commission, no lender. Get a cash offer on your Weymouth home, or talk with our team about your timeline first.
Take the easy way out.
Data: MLS PIN, single-family homes, Weymouth, through October 31, 2026.
Frequently Asked Questions
Are Weymouth homes still selling over asking price?
Not in October 2026. Weymouth homes sold for 99.94% of asking, the first below-list month since January, down from 105.05% in July. From August through October the average was still 102.23%.
How many homes are for sale in Weymouth MA?
Weymouth had 65 active single-family listings at the end of October 2026, up from 45 a year earlier and the most in our records back to early 2023.
How many homes sold in Weymouth in October 2026?
Twenty-two, down 41% from 37 in October 2025 and the fewest in any month since March 2026.
What is the average sale price in Weymouth?
The October 2026 average was $658,955, down 3.5% from a year earlier. Weymouth’s January–October 2026 average was $702,144.
Can I sell a Weymouth house that needs repairs in this market?
Yes. Bluefin Property Buyers purchases Weymouth homes as-is for cash, including houses with outdated systems, deferred maintenance or damage, with no repairs or commission.