
Plymouth is the largest housing market in this report by a wide margin — 419 single-family sales from January through August 2026, more than double the next busiest town. When something moves in Plymouth, it is not a statistical accident. There are enough transactions here that the trends mean something.
And the trend right now is genuinely unusual: more sales, at lower prices.
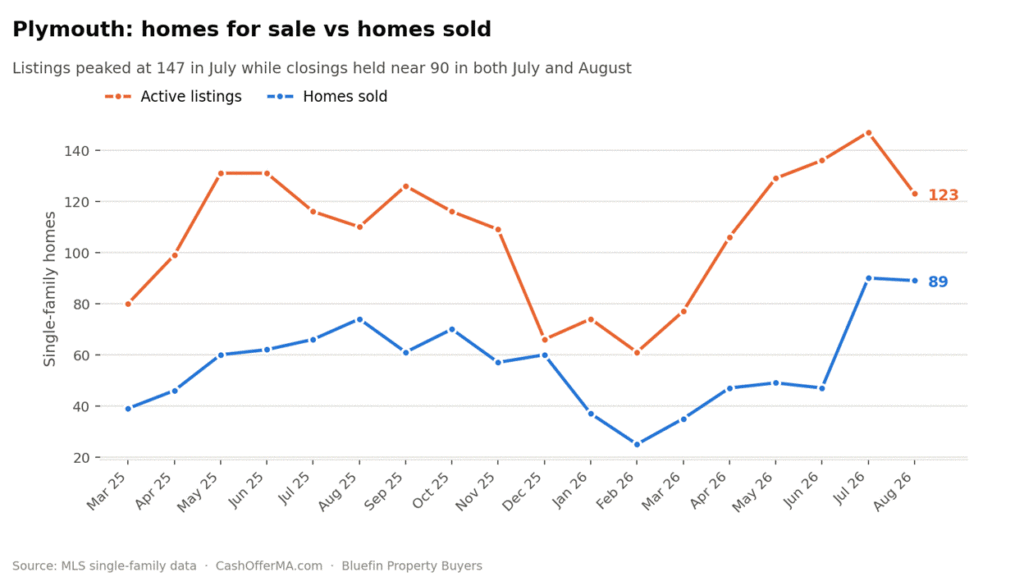
Plymouth closed 89 homes in August 2026 against 74 in August 2025, a 20.3% increase. July delivered 90. Those two months together account for 179 sales — 43% of the town’s entire January-through-August total, packed into eight weeks.
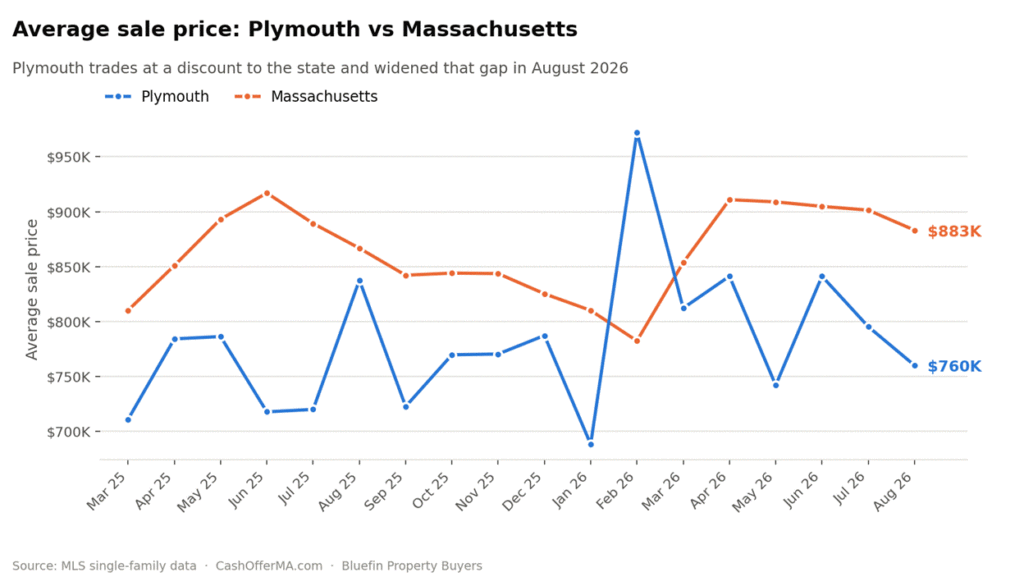
Meanwhile the average sale price fell to $760,004 in August, down 9.3% from $837,603 a year earlier.
Sell Your Massachusetts House Fast!
We buy houses in Massachusetts in ANY CONDITION! Get a CASH offer with no commissions, agents, or hidden fees. Just enter your property address, phone, and email below, and you could receive your cash offer within 24 hours!
Reading the price drop correctly
A 9.3% year-over-year price decline sounds alarming. It probably is not.
Look at the longer window and Plymouth prices are up. The weighted average across March through August 2026 was $792,870 against $763,529 in the same 2025 months — a 3.8% gain, comfortably ahead of the Massachusetts figure of 2.1%. Across January through August the town averaged $794,324.
What happened in August is that Plymouth sold a lot of homes, and the mix skewed toward the middle of the market. August 2025’s $837,603 was itself unusually strong — the highest August in the record and one of the top handful of months Plymouth has posted. Comparing this August to that August makes the decline look far more dramatic than the underlying reality.
The more useful comparison: Plymouth’s average sale price has bounced between roughly $740,000 and $840,000 all year without a clear directional trend. It is a wide, liquid market that is holding its level.
Where Plymouth genuinely has a problem
The pricing power has slipped, and this one is real.
Plymouth homes sold at 99.78% of asking in August 2026, down from 100.57% a year earlier. Across January through August the town averaged 99.78% against 101.12% in 2025. Plymouth is one of only three markets in this report — alongside Hull and, in August, Bridgewater — where the average home sells for less than the seller asked.
And listings are aging. Homes actively on the market in Plymouth have been sitting an average of 90 days, up 25% from 72 days a year ago. That is the second-longest active-listing shelf time in this report behind Hull. And the houses that are sitting on the market are not just the houses that had winter damage that lead to an empty house. Many of these homes that are sitting on the market are homes that are in good condition.
There is a curious split here worth noticing. Homes that close in Plymouth are doing so faster than last year — 41 days in August 2026 against 49 in August 2025, a 16% improvement. But the homes that don’t close are sitting longer than ever. Plymouth is sorting its inventory sharply into what moves and what doesn’t, and the pile of what doesn’t is growing.
The asking price on that unsold inventory is $1,039,783, up 13.5% year over year, while closed sales average $760,004. That $280,000 gap is the clearest possible statement of the problem: Plymouth’s unsold listings are priced for a market that isn’t showing up.
Inventory: peaked and receding
Plymouth’s active listings ran up to 147 in July 2026, the highest count in this record, before easing to 123 in August. That is up 11.8% from the 110 available in August 2025.
Months of inventory tells a more encouraging story than that suggests. Plymouth peaked at 3.31 months in May, and August’s two-month sales surge burned through enough of the backlog to bring it down to 1.79 months — barely above the statewide 1.66 and much healthier than where the town sat in the spring.
If September and October hold anywhere near summer’s pace, Plymouth will enter the winter in decent shape.
What Plymouth homeowners should take from this
Plymouth is a big, varied market and the averages hide a lot. A well-priced, well-maintained three-bedroom in Manomet or North Plymouth is in a completely different market from a waterfront property in Chiltonville or a dated cape out toward the pine barrens.
What the data says clearly is that correctly-priced homes are moving well — 89 sales in a month, 41 days to close, and inventory being absorbed. What it also says is that overpriced homes are accumulating, sitting 90 days and counting, in a town where the asking-price average has drifted $280,000 above where the market actually clears.
If your Plymouth property needs work, that gap is where you get caught. You can price it for its condition and watch it sell, or price it for what you hoped and watch it join the pile. The middle option — invest $40,000 and four months in getting it retail-ready — only makes sense if you have both the money and the patience, and if the numbers still work when you are done.
Bluefin Property Buyers offers the third path. We buy Plymouth houses for cash exactly as they stand. Cranberry bog properties, seasonal cottages, homes with septic issues, estate properties full of forty years of belongings, rentals with tenants in place — we buy all of it, without repairs, without a cleanout, without commission, and without a lender who can change their mind in week six.
See what your Plymouth home is worth to a cash buyer — free, no obligation, and you will have a real number in about a day. We also buy in nearby Halifax.
Take the easy way out.
Frequently Asked Questions
Are home prices falling in Plymouth MA?
The August 2026 average of $760,004 was down 9.3% from August 2025, but that comparison is against the highest monthly average in Plymouth’s record. On a matched March-to-August basis, Plymouth prices actually rose 3.8% year over year, ahead of the statewide 2.1%.
How many homes sell in Plymouth Massachusetts each month?
Plymouth is the busiest market in this report, with 419 single-family sales from January through August 2026. July and August each delivered around 90 closings, the two strongest months of the year.
Why are some Plymouth listings sitting for months?
Active unsold listings in Plymouth have been on the market an average of 90 days, and their average asking price of $1,039,783 sits roughly $280,000 above the $760,004 average closed sale. Overpriced inventory is accumulating while correctly-priced homes close in about 41 days.
Is Plymouth a buyer’s market in 2026?
It is close to balanced. Months of inventory stands at 1.79 versus 1.66 statewide, and homes sell just under asking at 99.78%. Plymouth is one of only a few markets in this report where the average buyer negotiates the price down.
How do I sell a Plymouth house that needs repairs or has septic problems?
Cash buyers purchase homes that conventional financed buyers cannot close on. Bluefin Property Buyers buys Plymouth properties as-is, including homes with failed Title V septic, structural issues, storm damage or tenant occupancy, with no repairs and no cleanout required.