
YOUR Massachusetts Real Estate Market Update for the week of June 10th
1,034. That’s the special number of the week. Because that’s how much more inventory a home buyer has to look at today compared to today last year. We are going to talk about that more, but it is hit or miss.
Consider a city like Brockton that has seen inventory go from 35 units today last year to 50 units today. That is nearly a 43% increase in inventory levels. Or Newton which has gone from 96 units last year to 125 units today. That is a 30% increase. Framingham, 16 to 27 units in a year which is a 69% increase. But then you have Winchester which has 24 units today and 28 today last year for a 14% decrease in inventory levels.
Don’t get me wrong. It’s a lot more hit, then miss. But real estate market conditions are local… Town local, not state local.
In this video we will go over the Single-Family and condo markets in the state of Massachusetts. And we will also do an interest rate update plus we will talk about some relevant current events.
Hi I am Jeff Chubb – My wife and I buy Massachusetts houses for cash in as-is condition. Quick closings. No home inspection. Let us know if you are looking to sell Massachusetts home fast.
Don’t want to pay 2.5% of the purchase price when buying a new house? Then take a look at our Purchase Power Plan. In this plan, Buyers pay for our services by the hour instead of 2.5 or 3% of the purchase price! This can save home buyers possibly tens of thousands of dollars. Reach out if you are looking to buy a house and want to save a small fortune in fees.
Let’s jump into the Single-Family market stats.
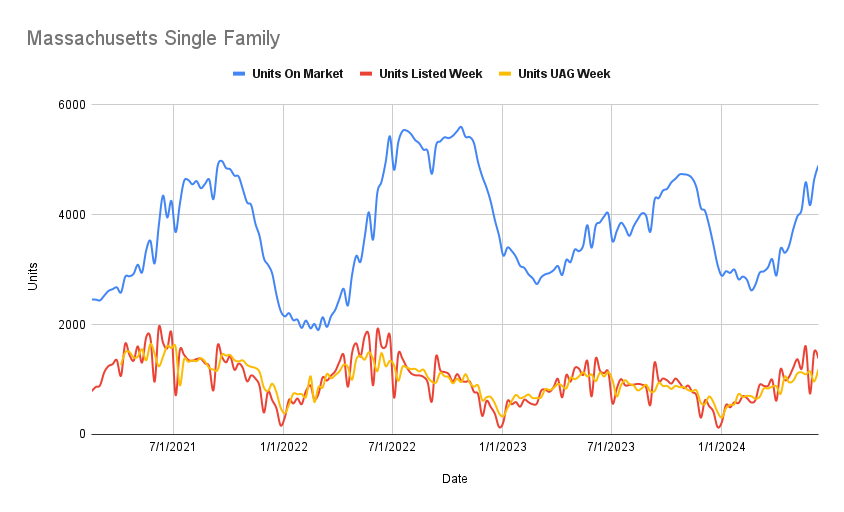
We are on the march to 5,000 units! We now have 4,893 Single Family homes on the market in the state of Massachusetts. This is 19.8% more homes on the market than there were just 28 days ago.
We would have to go back to the week of November 11th IN 2022 in order to find a time when we had more single family homes on the market in the state of Massachusetts.
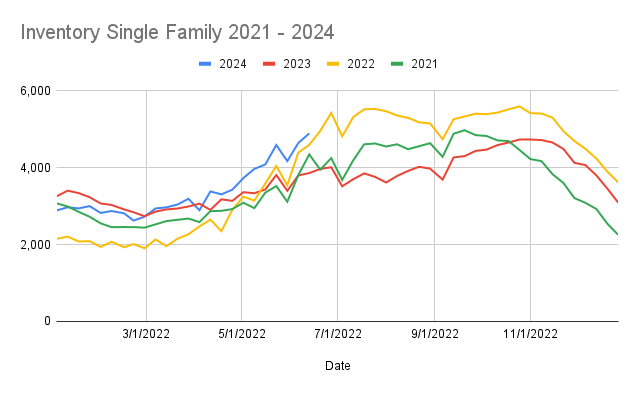
The inventory growth doesn’t look that impressive when compared to 2022, but compare it to that red line… The 2023 year. We now have 1,034 more houses on the market when compared to the same week last year. And 297 more houses on the market today than compared to today in 2022!
Keep in mind that the 2022 inventory run was thanks to a historic rate hike increases. And our inventory levels are higher and going nearly toe to toe. The question becomes, where is all this inventory coming from?
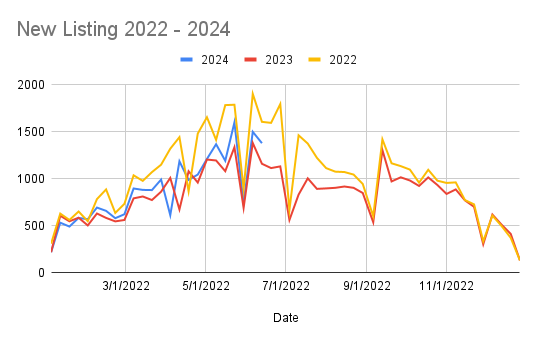
New Listings are down week over week, but still ahead of 2023 levels. This week we listed 1,380 Single Family homes in the state of Massachusetts. This is 219 units or 18.9% more than the same week in 2023.
New Listings continue to come in strong. This is where the inventory growth is coming from as sales are consistent. But where are all of these new sellers coming from, I guess that is the better question.
Meanwhile, the 4 week rolling average is 1,259 units.
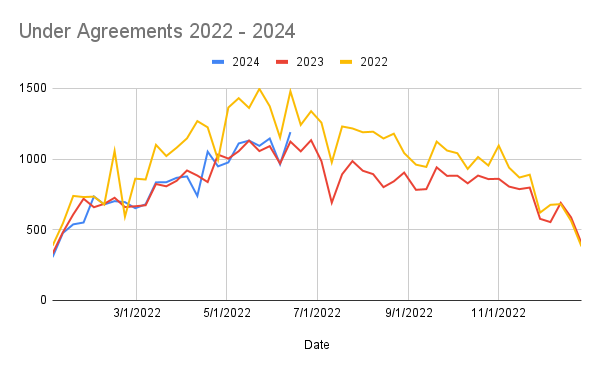
This week we put 1,190 Single family homes under agreement this week. This is 67 units or 6% higher than the same week last year when we put 1,123 homes under agreement.
It’s this imbalance week after week of new listings and under agreements that is the driving force of the inventory growth.
The four week rolling average is 1,083 units.
So when compared to last year’s market… New listings were up by 18.9% while under agreements were up by 6%.
The Pendings to New Listing ratio was 79.3%! We had 1,190 units that went under agreement this week which is compared to 1,501 new listings from two weeks ago.
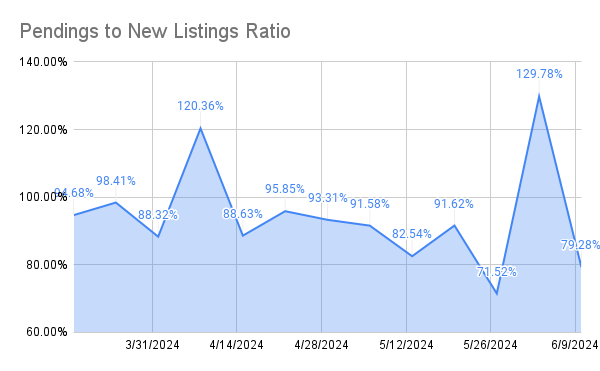
The 79% is compared to the 81.6% that we saw this week last year.
The average for the last four weeks is 93%. This is compared to weeks 5 through 8 where it was 90.8%.
There were 633 Single Family homes that closed last week for an average sales price of $864 thousand dollars and a median sales price of $675 thousand dollars. Sales levels compared to the same week last year were down by 10 units or 1.6% as there were 643 Single Family homes that sold this week last year for an average price of $748k.
Months of inventory. This is how we determine what type of market we are in. 0 to 5 months is considered a sellers’ market with the closer to 0 you get… The more aggressive a seller’s market.
This week’s Months of inventory fell to 2.18 months from last week’s 2.26 months. The 2.18 months this week is compared to the 1.77 months this week last year.
Real quick, my shameless plug… I just wanted to mention that if you are thinking about buying or selling a home, then it would be a true pleasure to help!
Now onto the Condo market…
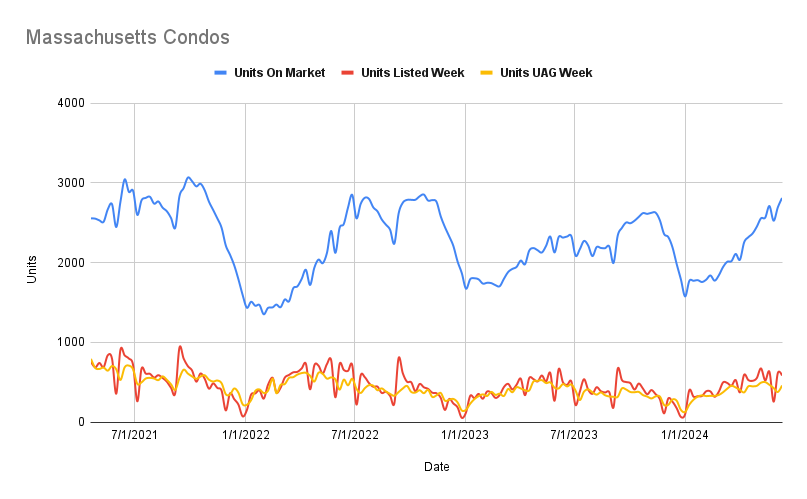
We now have 2,811 condos on the market as of Monday. This means that there is 9.6% more inventory on the market today than the inventory levels on the market just 28 days ago.
When was the last time we had this much condo inventory on the market you ask? The week of October 24th… 2022!
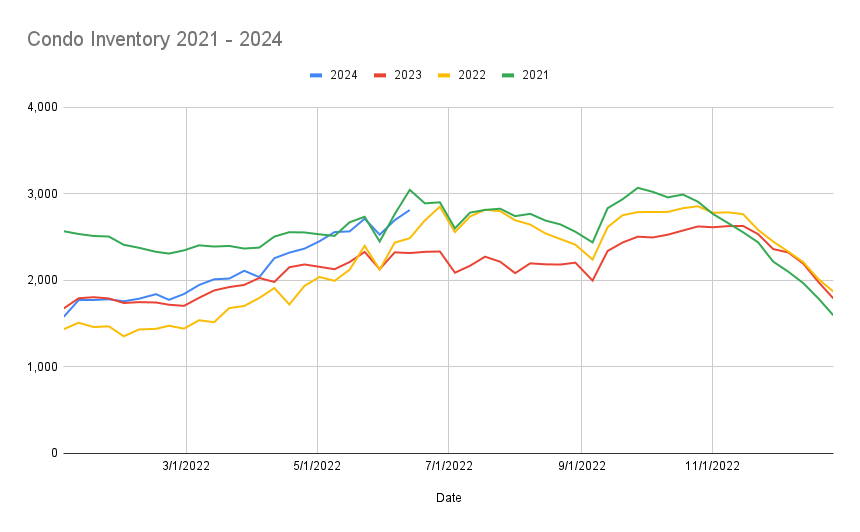
We now have 497 more units on the market today than today last year. 326 more units than compared to the inventory levels of 2022 and are 233 units short of the inventory levels in 2021.
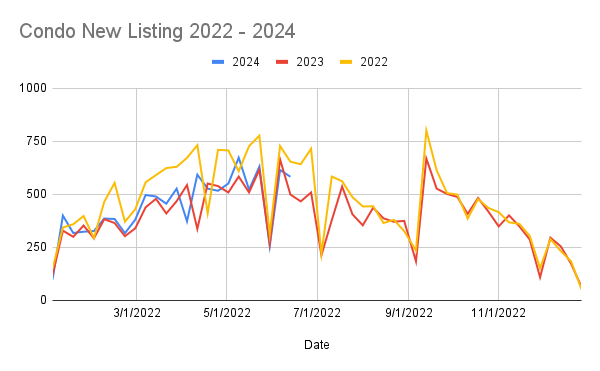
There were 583 condos that came on the market last week with the four week rolling average of 506 units.
The 583 units listed was 84 units or 16.8% more than the 499 condos that came on the market the same week in 2023.
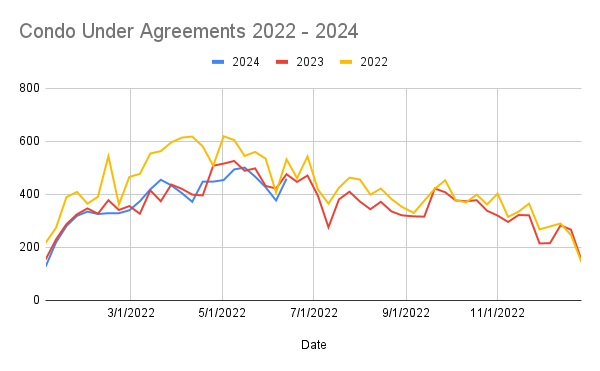
New listings were higher than last year, but under agreements fell short. This week we put 459 units under agreement. This 459 condo sales was 17 units or 3.6% less than last year when we put 476 condos under agreement.
The four week rolling average for under agreements is 443 units.
So 16.8% more listings that came on the market when compared to this week last year while selling 3.6% fewer condos. That is a pretty substantial imbalance!
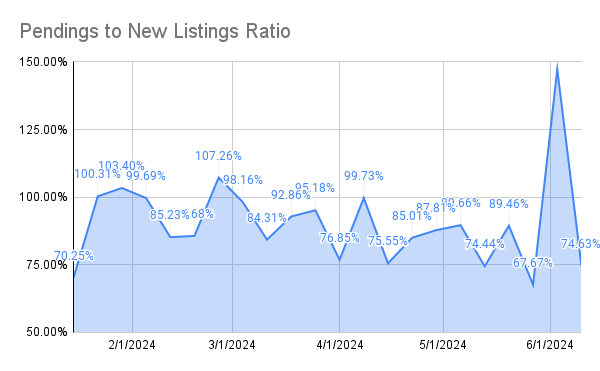
The condo Pendings to New Listing ratio was 74.6%. This is compared to the 71.6% that we saw this time last year. The average for the last 4 weeks is 94.7% which is compared to 84.2% for weeks 5 through 8.
There were 319 condos that sold this week for an average sales price of $711 thousand dollars and a median sales price of $560 thousand dollars. This same week last year there were 302 condos that sold. So sales levels were down by 5.6%.
Months of Inventory fell to 2.53 months from last week’s 2.64 months. This is compared to the months of inventory levels of 2.11 months this week last year.
We have seen months of inventory down in the Single Family and Condo market… This is normal for this time of year.
Any chance you can do me a favor? Can you hit that like button? Believe it or not, but it makes a huge difference for me and the channel as it plays with the YouTube algorithm. And SUBSCRIBING… Well that doesn’t hurt either!
Time to talk about Interest rates…
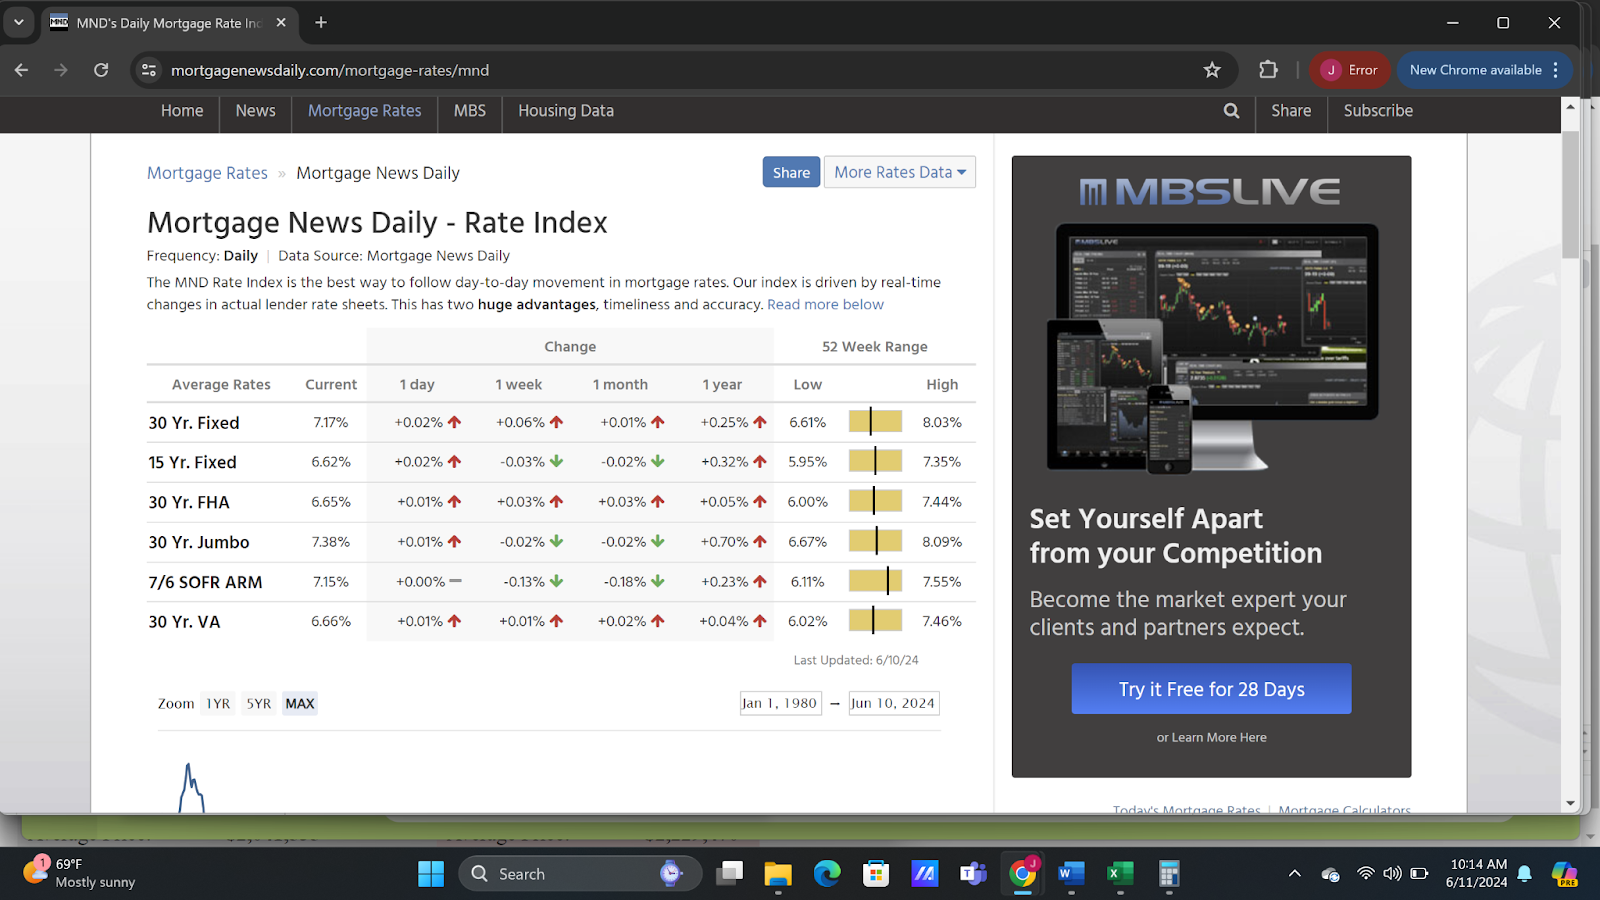
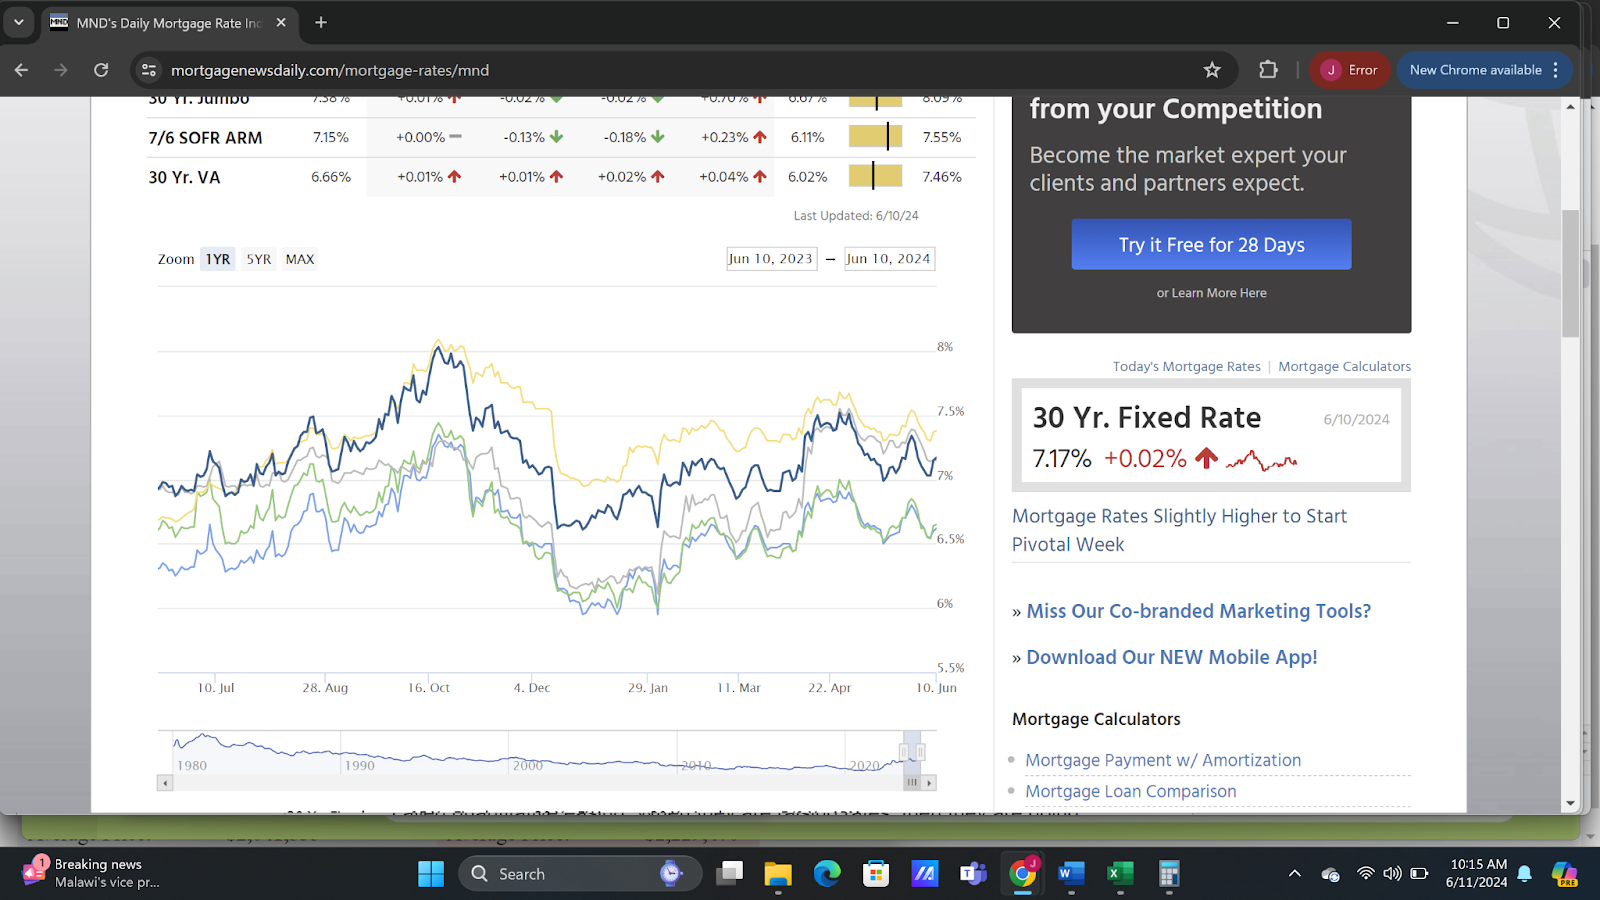
When it comes to interest rates, we have been relatively flat. One week rates have gone up a little, but when you look at it from a one month perspective… Flat.
But we have the Consumer Price Index on Wednesday. This is going to be an interest rate market mover.
If it comes in at .1%, then rates I believe will go down. It will give cover to those who are hoping and praying and thinking that the FED will cut in September.
If it’s higher, then I would imagine rates to go up. I know they goose these numbers, but I think it’s going to be higher. Yes, energy prices should be down, but the shelter cost I foresee as overshadowing that decrease in energy.
Did you see this?
86% percent of consumers say it’s a bad time to buy a house according to Fannie Mae.
Consumers cite a lack of affordability as the reason why.
The percentage of consumers who said it was a bad time to buy grew from 79% in April to 86% in May!
Meanwhile the Fannie Mae Home Purchase Sentiment Index decreased 2.5 points in may to 69.4 which marked an all-time low.
It’s staggering that only 14% of consumers said it was a good time to buy which is down from 20% last month! The amount of consumers saying it was a good time to sell a home also fell from 67% to 64%.
So in one breadth consumers are saying that it’s an awful time to buy Real Estate BUT in the other breadth let’s have the conversation that homeowners are now sitting on 17 Trillion… $17 Trillion dollars in home equity.
American mortgage holders now have access to 11 Trillion dollars in tappable equity. This is a record for U.S. Homeowners.
Listen to this stat. The amount of equity is so huge that if all 48 million American Homeowners spent $10 million of their tappable equity a day, it would take nearly 3,000 years to exhaust it.
Or here is another one… This equity is the equivalent of 12.1 million TONS of dollar bills.
It’s more money than the GDP of Japan, India and the U.K… COMBINED!
I wonder how many people said it was a bad time to buy in the late 70s and early 80s. If they kept track of the data back then like we do today, then I would think it would be even worse in regards to how many people said it was a good time to buy… I mean, interest rates were near 20% in the early 1980s.
Bet those homeowners who bit the bullet and bought when everyone else said no are pretty happy right now… Or maybe it’s the kids who are selling mom and dads house who bought in the late 70s and early 80s that are pretty happy.
Here is the point. Your viewpoint shouldn’t be a short period of time when buying real estate. Over the long run, there isn’t a better investment out there. And no investment provides you the intangible benefits of being able to live in it, gets you yearly tax advantages and gives you the pride of ownership like owning a house does.
Do you need a We Buy Houses Massachusetts type of company to give you a fair offer for your house? Then we would love to be the ones to help you!
Reach out today by calling 781-724-5674 or reaching out below!