
July 2026 | MLSPIN Data Pulled 8/4/2026
| ACTIVE LISTINGS 31 -6.1% YoY | HOMES SOLD 49 +2.1% YoY | AVG SOLD PRICE $724,539 +9.4% YoY | MONTHS OF INVENTORY 0.83 vs. 0.88 last July |
July 2026 Snapshot
While Massachusetts as a whole is seeing inventory build and competition among sellers ease slightly, Weymouth is moving in the opposite direction. Active listings actually dipped year-over-year, from 33 in July 2025 to 31 in July 2026, and at just 0.83 months of supply, Weymouth has the some of the tightest inventory on the South Shore – well under even a single month of homes available at the current sales pace.
Year-Over-Year Comparison: July 2026 vs. July 2025
| Metric | July 2025 | July 2026 | YoY Change |
| Active Listings | 33 | 31 | -6.1% |
| Active Avg. List Price | $789,072 | $741,132 | -6.1% |
| Active Avg. Days on Market | 45 | 54 | +9 days |
| Homes Sold | 48 | 49 | +2.1% |
| Sold Avg. Days on Market | 22 | 22 | flat |
| Average Sold Price | $662,254 | $724,539 | +9.4% |
| Sold-to-List Ratio | 102.15% | 105.05% | +2.90 pts |
| Months of Inventory | 0.88 | 0.83 | -0.05 mo. |
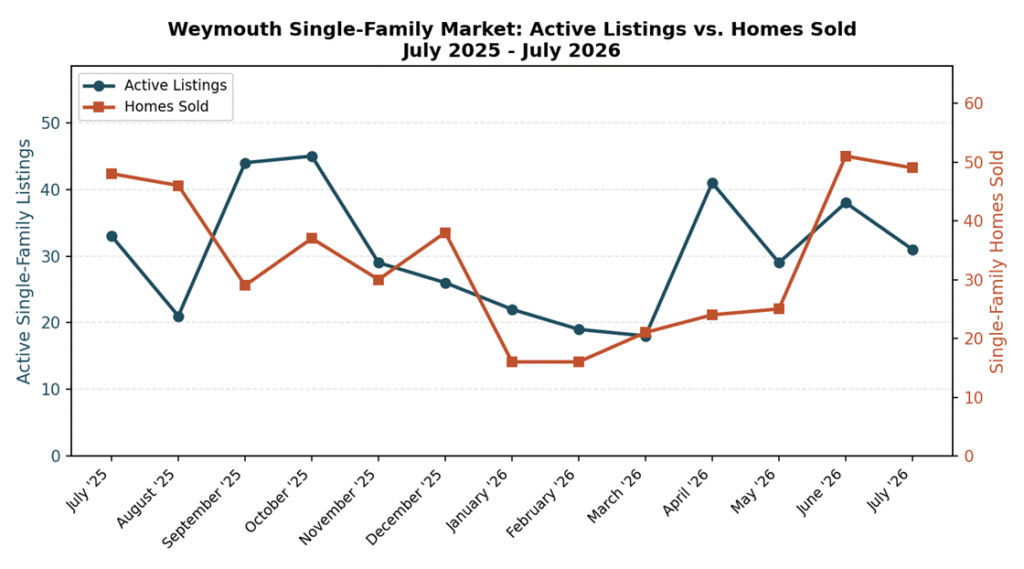
Chart: Weymouth active listings vs. homes sold, July 2025-July 2026.
Trend: First Seven Months of 2026
That scarcity is showing up directly in price competition. Homes sold for an average of 105.05% of list price in July, up nearly three full points from 102.15% a year ago, and the highest sold-to-list ratio of any market covered here – a strong signal that multiple-offer situations are still common in Weymouth even as they’ve cooled elsewhere in the state. The average sold price climbed to $724,539, up 9.4% year-over-year, and that strength held up across the broader spring-to-summer window too: the March-through-July average was up 5.0% versus the same months in 2025. Sale volume ticked up modestly (49 homes in July versus 48 last year), essentially matching last year’s pace even with less inventory to draw from.
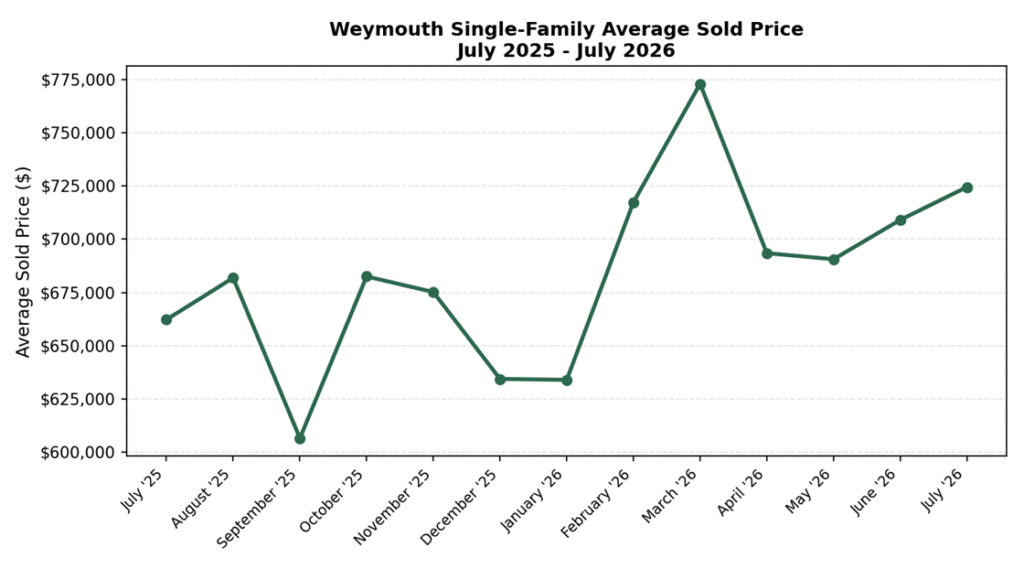
Chart: Weymouth average single-family sold price by month, July 2025-July 2026.
What This Means If You’re Thinking About Selling
If you own a home in Weymouth, this is about as favorable a seller’s market as exists in this report right now – low supply, fast-moving sales, and buyers regularly paying above asking. That said, competitive bidding situations aren’t for everyone, especially if your home needs repairs or you’re working against a deadline. Bluefin Property Buyers offers Weymouth homeowners a straightforward alternative: a direct cash offer with no repairs, no staging, and no financing contingencies. Learn more at our We Buy Houses in Weymouth MA page and take the easy way out.
Frequently Asked Questions (FAQs)
What is the average home price in Weymouth, MA in 2026?
Weymouth’s average single-family sold price was $724,539 in July 2026, up 9.4% from $662,254 in July 2025.
Is Weymouth, MA a seller’s market right now?
Very much so – Weymouth had just 0.83 months of inventory in July 2026, among the tightest of any South Shore town, and homes sold for an average of 105.05% of asking price.
How many homes are for sale in Weymouth, MA?
Weymouth had 31 active single-family listings in July 2026, down slightly from 33 a year earlier.
Do homes in Weymouth, MA sell above asking price?
Yes. The average sold-to-list ratio in Weymouth was 105.05% in July 2026, meaning homes are regularly selling above their listed price.
How fast do homes sell in Weymouth, MA?
Homes that sold in Weymouth in July 2026 averaged 22 days on market, the same pace as July 2025.