
July 2026 | MLSPIN Data Pulled 8/4/2026
| ACTIVE LISTINGS 11 +22.2% YoY | HOMES SOLD 3 0.0% YoY | AVG SOLD PRICE $718,000 +15.7% YoY | MONTHS OF INVENTORY 4.00 vs. 1.64 last July |
July 2026 Snapshot
A caveat up front: West Bridgewater is one of the smallest markets in West Bridgewater, with just 3 single-family sales in July of both 2026 and 2025, so any percentage change here should be read as a snapshot of a handful of transactions rather than a broad trend. With that said, the town’s months-of-inventory metric jumped from 1.64 to 4.00 year-over-year – a notable shift toward more balance, though driven mainly by 11 active listings now sitting against a thin sales pace rather than a flood of new supply.
Year-Over-Year Comparison: July 2026 vs. July 2025
| Metric | July 2025 | July 2026 | YoY Change |
| Active Listings | 9 | 11 | +22.2% |
| Active Avg. List Price | $932,966 | $860,063 | -7.8% |
| Active Avg. Days on Market | 62 | 53 | -9 days |
| Homes Sold | 3 | 3 | 0.0% |
| Sold Avg. Days on Market | 20 | 18 | -2 days |
| Average Sold Price | $620,333 | $718,000 | +15.7% |
| Sold-to-List Ratio | 100.12% | 103.12% | +3.00 pts |
| Months of Inventory | 1.64 | 4.00 | +2.36 mo. |
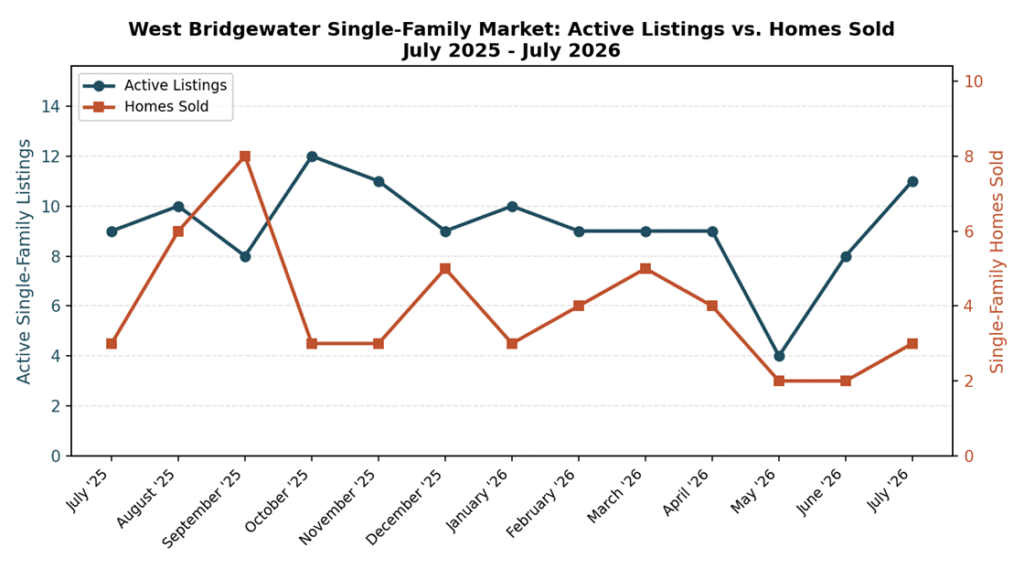
Chart: West Bridgewater active listings vs. homes sold, July 2025-July 2026.
Trend: First Seven Months of 2026
Where West Bridgewater stands out is price strength on the homes that did sell: the average sold price reached $718,000 in July, up 15.7% from $620,333 a year ago, and homes sold for 103.12% of list price on average – three points above last July’s 100.12%. That pricing strength held up over the broader March-through-July window as well, with average sold price up 19.2% year-over-year, even as sales volume for that stretch actually ran behind 2025’s pace (16 homes vs. 23). Active homes are also moving faster toward finding a buyer, averaging 53 days on market compared to 62 a year ago.
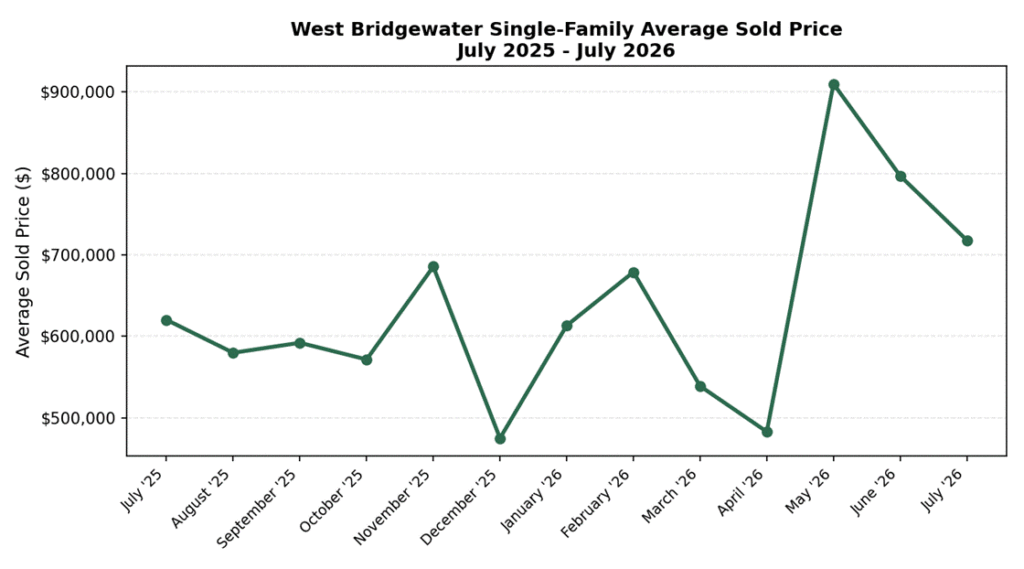
Chart: West Bridgewater average single-family sold price by month, July 2025-July 2026.
What This Means If You’re Thinking About Selling
With so few transactions, West Bridgewater homeowners weighing a sale don’t have a lot of recent comparable data to lean on, which can make pricing and timing a traditional listing more uncertain. If you’d prefer a more predictable path, Bluefin Property Buyers offers direct cash purchases on West Bridgewater homes with no need to wait for the right buyer to come along. Visit our We Buy Houses West Bridgewater MA page to see how it works – take the easy way out.
Frequently Asked Questions
What is the average home price in West Bridgewater, MA?
West Bridgewater’s average single-family sold price was $718,000 in July 2026, up 15.7% from $620,333 in July 2025 – though with only 3 sales in each of those months, this figure reflects a small sample.
How many homes sell in West Bridgewater, MA each month?
West Bridgewater is a very low-volume market; just 3 single-family homes sold in July of both 2025 and 2026.
Is West Bridgewater, MA a buyer’s or seller’s market?
Months of inventory rose from 1.64 to 4.00 year-over-year, suggesting a shift toward more balance, though the small number of sales makes this figure sensitive to individual transactions.
How fast are homes selling in West Bridgewater, MA?
Homes that sold in West Bridgewater in July 2026 spent an average of 18 days on market, down slightly from 20 days a year earlier.
Should I sell my house in West Bridgewater now?
Prices on recent sales are up meaningfully year-over-year, but with so few transactions to compare against, getting a local, property-specific valuation is especially important in West Bridgewater.