
Rockland is a small, well-located South Shore town off Route 3 and Route 123, popular with commuters who want easy highway access without big-city prices. That popularity showed up loud and clear in the first half of 2026: this was, month after month, one of the tightest housing markets in the region.
Under Two Months of Supply, Every Single Month
Months of inventory in Rockland never once climbed above 1.78 during the first half of 2026, and dipped as low as 0.73 in April. For context, real estate professionals typically consider 5 to 6 months of supply a balanced market — Rockland spent the entire first half of the year at roughly a quarter of that benchmark or less.
- January 2026: 0.94 months of inventory, 8 active listings
- April 2026: 0.73 months of inventory — the tightest point of the year, with only 6 homes on the market
- June 2026: inventory nearly doubled to 16 active listings, though months of supply still sat at just 1.78
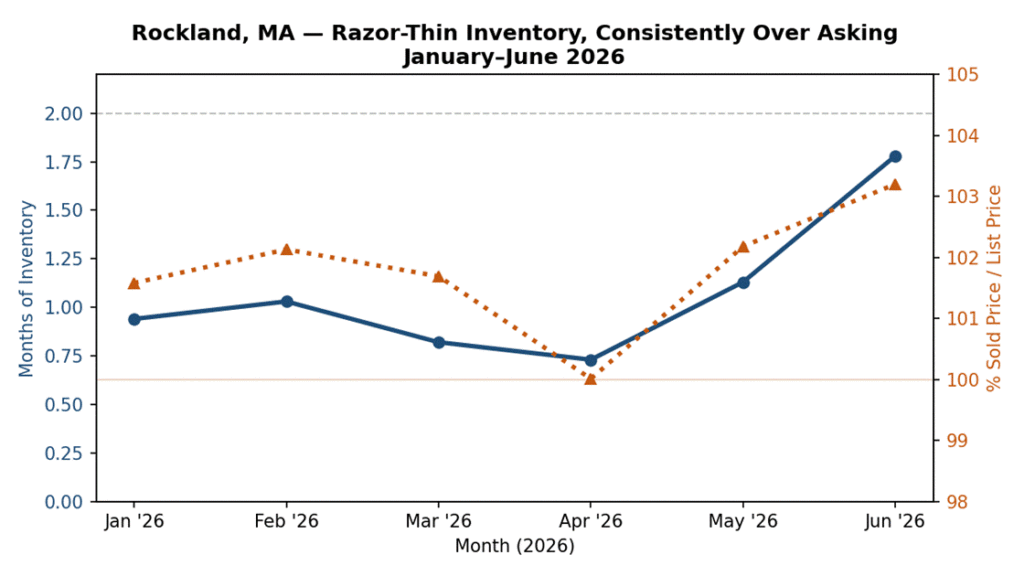
Rockland months of inventory (left axis) vs. average sold-to-list price ratio (right axis), Jan–Jun 2026.
Homes Consistently Sold Above Asking
With that little to choose from, it’s no surprise buyers were competing hard. Rockland’s average sold-to-list ratio was above 100% in every single month of the first half of 2026 — from 101.58% in January to a high of 103.20% in June. That’s a remarkably consistent pattern; unlike many towns where bidding intensity comes and goes month to month, Rockland buyers paid a premium over asking price all winter, spring, and into early summer without exception.
But Buyers Still Took Their Time on the Ones That Sold
Here’s the twist: despite razor-thin supply and homes routinely selling over list price, average days on market for sold homes didn’t collapse the way you might expect. Sold homes averaged 40 days on market in April 2026 — more than triple the 12-day average from April 2025. June 2026 sold homes averaged 40 days as well, up from 23 days in June 2025.
That combination — extremely low inventory, consistent over-asking sales, but a longer runway to get there — suggests buyers in Rockland are still doing their homework: multiple showings, careful comparison, and more deliberate offers, even when they know they’re likely to end up in a competitive bidding situation.
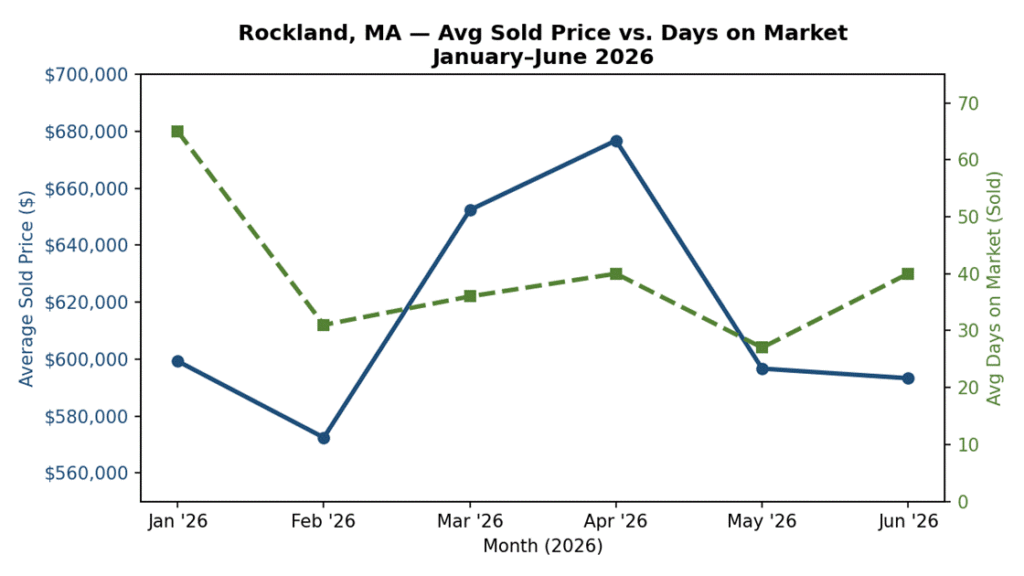
Rockland average sold price (line) vs. average days on market for sold homes (right axis), Jan–Jun 2026.
How Rockland Compares to Massachusetts Overall
Statewide, Massachusetts months of inventory ranged from 1.04 to 2.45 during the same period — already tight by national standards. Rockland ran meaningfully tighter than that statewide figure in nearly every month, reinforcing that this is one of the more in-demand corners of the South Shore market right now.
What This Means If You’re Selling in Rockland
Extremely low inventory and over-asking sales sound like an easy sell, and in many cases they are. But the longer days-on-market trend is a reminder that buyers are still being selective — a home that’s priced too aggressively or shows poorly can still sit longer than the headline numbers suggest, even in a market this tight.
If you’d rather skip the showings, the back-and-forth negotiating, and the uncertainty of exactly how many weeks your home will be on the market, there’s a faster path.
Sell Your Massachusetts House Fast!
We buy houses in Massachusetts in ANY CONDITION! Get a CASH offer with no commissions, agents, or hidden fees. Just enter your property address, phone, and email below, and you could receive your cash offer within 24 hours!
Thinking About Selling in Rockland?
Market data can tell you a lot about pricing and timing, but it can’t tell you what your specific house, your specific timeline, and your specific situation call for. If a slow-moving buyer pool, financing fall-throughs, or the thought of months of showings doesn’t sound appealing, there’s another option. Bluefin Property Buyers buys houses throughout Massachusetts in as-is condition, for cash, on a timeline that works for you — no repairs, no staging, no waiting on a buyer’s mortgage approval, and no commissions.
As we always say: Take the easy way out.
Curious what your Rockland property is really worth in cash, as-is, no obligation? Get your free cash offer for your Rockland home here, or see how these numbers compare across Massachusetts as a whole.
Rockland Housing Market FAQs
Is Rockland, MA a seller’s market in 2026?
Yes, strongly so. Months of inventory never rose above 1.78 during the first half of 2026 and dipped to 0.73 in April, far below the 5-to-6-month benchmark for a balanced market.
Do homes in Rockland sell above asking price?
Consistently, yes. Rockland’s average sold-to-list price ratio was above 100% in every month from January through June 2026, ranging from 101.58% to 103.20%.
How long does it take to sell a house in Rockland right now?
It varies, but 2026 has generally taken longer than 2025. April 2026 sold homes averaged 40 days on market, versus just 12 days in April 2025, and June 2026 averaged 40 days versus 23 days the year before.
What is the average home sale price in Rockland, MA?
Through the first half of 2026, Rockland’s average sold price ranged from $572,417 in February to a high of $676,778 in April.
Why is Rockland’s inventory so low?
Rockland’s combination of highway access (Route 3 and Route 123), relative affordability compared to towns closer to Boston, and steady commuter demand has kept buyer interest high and listings scarce for an extended stretch, with months of inventory sitting well under half of what’s considered a balanced market for most of 2026.