
July 2026 | MLSPIN Data Pulled 8/4/2026
| ACTIVE LISTINGS 14 +16.7% YoY | HOMES SOLD 14 0.0% YoY | AVG SOLD PRICE $597,000 +1.7% YoY | MONTHS OF INVENTORY 1.00 vs. 0.77 last July |
July 2026 Snapshot
Rockland is the picture of a stable, steady market: exactly 14 single-family homes sold in July 2026, matching July 2025’s total precisely, with the average sold price up just modestly to $597,000 from $587,250 (+1.7%). Homes continue to sell comfortably above asking, at 103.68% of list price, essentially in line with last July’s 103.35%.
Year-Over-Year Comparison: July 2026 vs. July 2025
| Metric | July 2025 | July 2026 | YoY Change |
| Active Listings | 12 | 14 | +16.7% |
| Active Avg. List Price | $711,449 | $585,735 | -17.7% |
| Active Avg. Days on Market | 18 | 36 | +18 days |
| Homes Sold | 14 | 14 | 0.0% |
| Sold Avg. Days on Market | 29 | 30 | +1 day |
| Average Sold Price | $587,250 | $597,000 | +1.7% |
| Sold-to-List Ratio | 103.35% | 103.68% | +0.33 pts |
| Months of Inventory | 0.77 | 1.00 | +0.23 mo. |
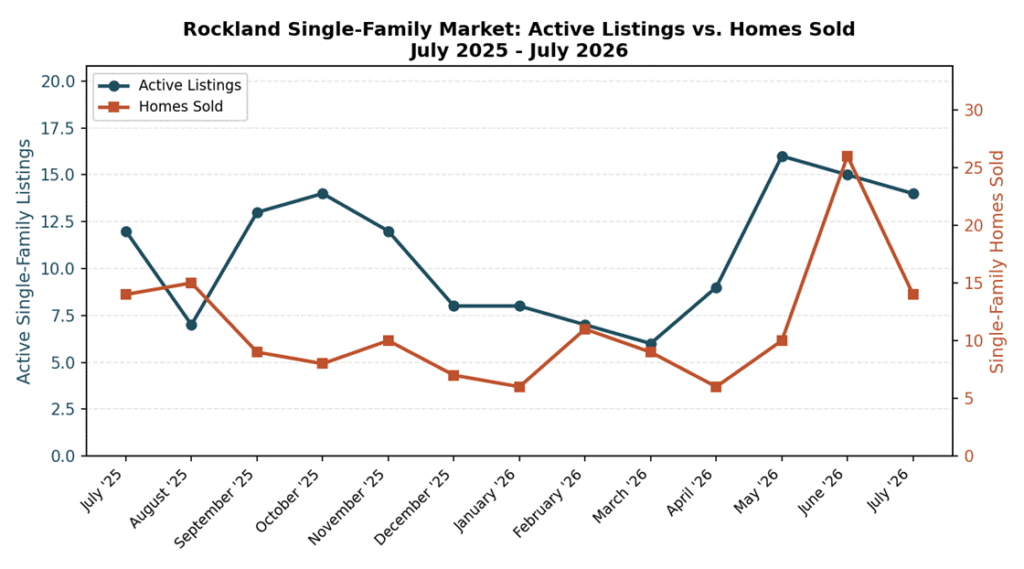
Chart: Rockland active listings vs. homes sold, July 2025-July 2026.
Trend: First Seven Months of 2026
The clearest shift in Rockland is on the active-listing side: homes currently on the market are averaging 36 days before finding a buyer, double the 18 days from a year ago, even as active inventory grew modestly to 14 listings from 12. That divergence – flat sold-side days-on-market (30 vs. 29) paired with slower-moving active listings – suggests some of the newer inventory coming onto the market is sitting a bit longer before attracting offers, possibly reflecting pricing or condition rather than a fundamental change in buyer demand. Sales volume across the broader March-through-July window ran close to last year’s pace as well (65 homes vs. 68, a 4.4% dip), reinforcing the overall picture of consistency rather than dramatic change.
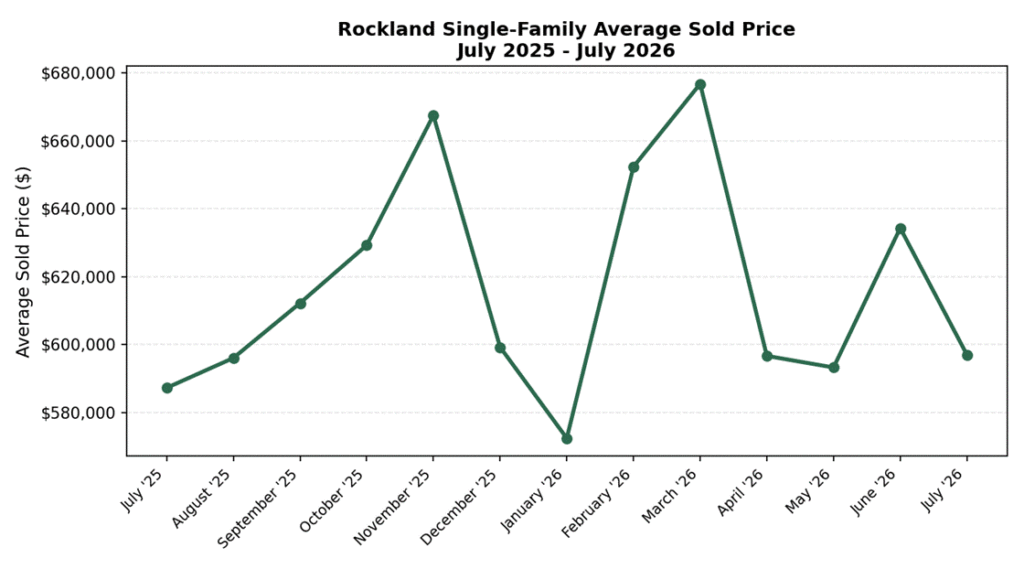
Chart: Rockland average single-family sold price by month, July 2025-July 2026.
What This Means If You’re Thinking About Selling
For Rockland homeowners, this steadiness can be reassuring, but it also means today’s listings need to work a bit harder than last year’s did to move quickly – pricing and presentation matter more when active days-on-market have doubled. If you’d rather not gamble on how long your home sits, Bluefin Property Buyers offers Rockland homeowners a direct, no-obligation cash offer with a certain timeline. Visit our We Buy Houses for Cash in Rockland MA page to learn more and take the easy way out.
Frequently Asked Questions (FAQs)
What is the average home price in Rockland, MA in 2026?
Rockland’s average single-family sold price was $597,000 in July 2026, up 1.7% from $587,250 in July 2025.
Is Rockland, MA a seller’s market right now?
Yes – at 1.00 month of inventory, Rockland remains a tight seller’s market, and homes sold for 103.68% of list price on average in July 2026.
How many homes sold in Rockland, MA in July 2026?
14 single-family homes sold in Rockland in July 2026, matching July 2025’s total exactly.
How fast are homes selling in Rockland, MA?
Homes that sold in Rockland in July 2026 averaged 30 days on market, close to July 2025’s 29 days, though active (unsold) listings are taking twice as long to attract offers as a year ago.
Is it a good time to sell a house in Rockland, MA?
Consistent sales volume, modest price growth, and above-asking sale prices make Rockland a solid market for sellers, though newer listings should be priced carefully given longer active days-on-market.