
Quincy is running two markets at once right now, and they are pointing in opposite directions.
Market number one: prices. The average Quincy single-family home sold for $856,860 in August 2026, up 12.4% from $762,070 a year earlier. Pull back and look at the full fifteen-year history and that figure ranks as the sixth-highest monthly average across 178 months of records. In terms of what a Quincy house is worth, this is close to the top of the mountain.
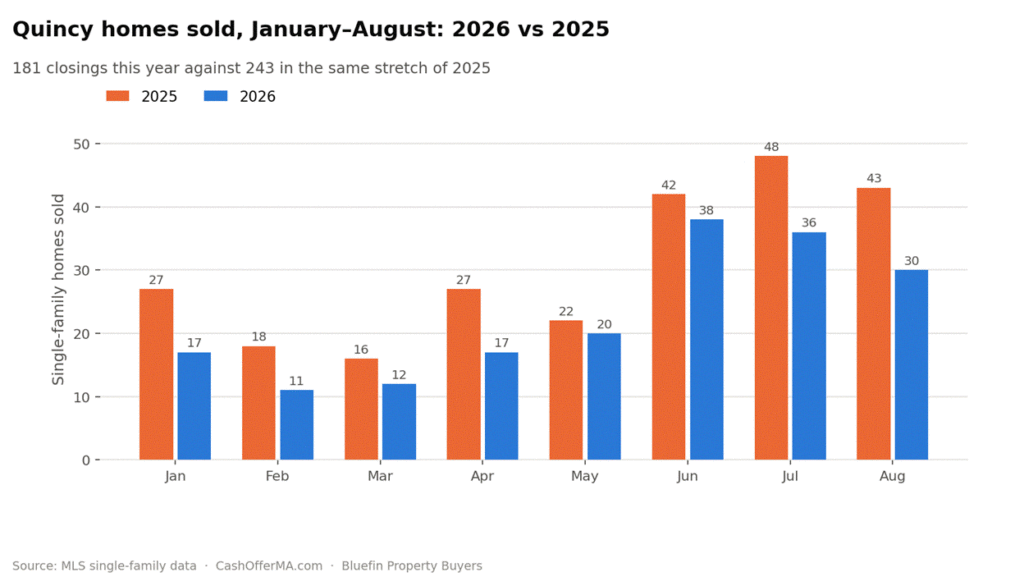
Market number two: volume. Thirty homes sold in Quincy last month. In August 2025, forty-three did. That is a 30% collapse in transactions, and it is not a one-month fluke. Across January through August, Quincy recorded 181 single-family closings in 2026 against 243 in the same eight months of 2025 — 62 fewer sales, a 25.5% drop.
Prices at record highs, transactions down a quarter. Those two things do not usually live together, and understanding why they do here tells you almost everything about Quincy in 2026.
Sell Your Massachusetts House Fast!
We buy houses in Massachusetts in ANY CONDITION! Get a CASH offer with no commissions, agents, or hidden fees. Just enter your property address, phone, and email below, and you could receive your cash offer within 24 hours!
The bottleneck was never demand
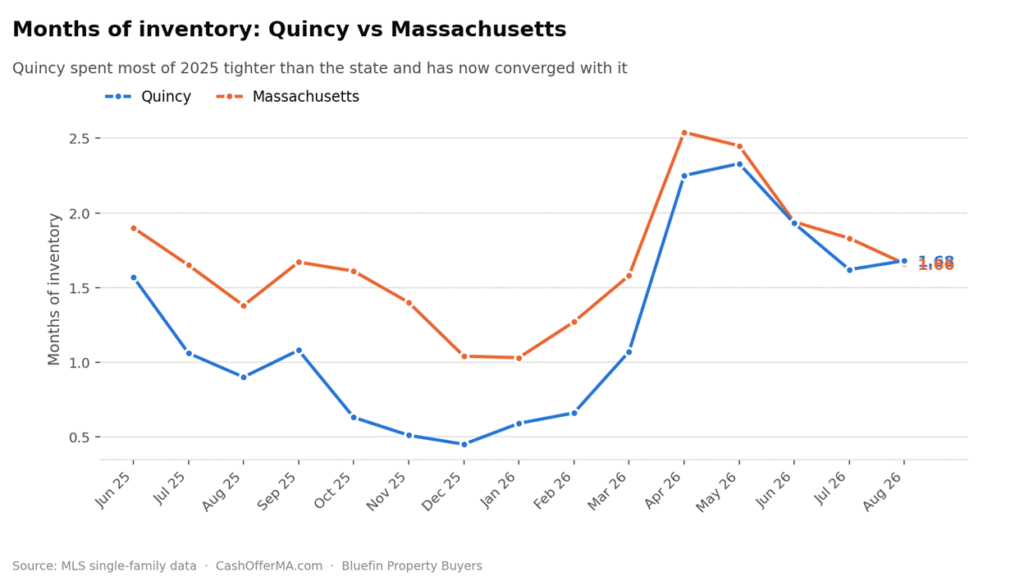
Quincy spent the back half of 2025 running on empty. Active listings dropped to 17 in November, then 14 in December, then 17 in January 2026 — a city of roughly 100,000 people with barely a dozen and a half single-family homes for sale. Months of inventory sank to 0.45 in December. That is not a market. That is a queue.
What has changed in 2026 is the supply side, and it has changed fast. Active listings climbed steadily through the spring and hit 52 in August 2026 — up 48.6% from the 35 available in August 2025, and the highest count in this window. Buyers who spent last winter with nothing to look at now have real choice for the first time in a long while.
That is also why months of inventory jumped from 0.90 in August 2025 to 1.68 today, an 87% increase. Quincy has gone from one of the tightest markets in Greater Boston to something that now looks almost exactly like the state average of 1.66 months.
Why the sales count fell anyway
If there is more to buy, why are fewer homes selling?
Part of it is the January and February hole. Quincy sold 17 homes in January 2026 and just 11 in February, against 27 and 18 in the same months of 2025. That is 17 sales lost before spring even started, and in a market this size that gap is hard to make back.
Part of it is price. A 12.4% year-over-year jump in average sale price prices some buyers out entirely. When the average Quincy single-family crosses $850,000, the pool of people who can write that check gets smaller.
And part of it is simply that the surge of listings arrived late. Inventory did not really build until June, July and August. Those homes are on the market now; many of them will close in September and October. Quincy’s fall numbers may look considerably better than its spring ones.
Quincy vs the state
Set Quincy against the Massachusetts numbers and the divergence is sharp.
Statewide, sales volume across March–August was essentially flat year over year, down 0.4%. In Quincy, that same window fell 22.7%. Statewide, prices rose 2.1% over that stretch. In Quincy, they rose 6.8%.
Quincy is doing less business at higher prices while the state does roughly the same business at slightly higher prices. That is the profile of a market where scarcity, not enthusiasm, is setting the price.
One more contrarian data point. Homes that are actively listed in Quincy have been sitting an average of 48 days, down sharply from 68 days a year ago. And closed sales still went at 100.21% of asking. So the listings that come to market in Quincy are moving, and they are getting their price. The problem was never that Quincy homes are hard to sell. It is that there have not been enough of them.
Thinking about selling in Quincy?
If you own a Quincy single-family home in good shape, the numbers say list it. You are selling into near-record pricing with fewer than sixty competitors citywide and a 48-day average shelf time on active listings. That is a strong position.
The picture changes if the house is not ready for that. Quincy has a lot of older housing stock — triple-deckers converted decades ago, mid-century capes in Wollaston and Merrymount, homes that have been in one family since the Kennedy administration. Getting one of those retail-ready can mean a five-figure investment and months of contractor scheduling before you list. If the property came to you through an estate, or there are tenants in place, or you simply live in Arizona now, that timeline gets harder still.
Bluefin Property Buyers buys Quincy houses for cash, exactly as they stand. No repairs. No cleanout — leave what you do not want. No commission, no open houses, no financing contingency that falls apart in week six. We handle the paperwork and you pick the closing date.
If that sounds better than six months of contractors, get a no-obligation cash offer on your Quincy home and see the number before you commit to anything. And if you are weighing Quincy against the wider picture, our Massachusetts market overview covers the statewide trends behind these numbers.
Take the easy way out.
What is the average home price in Quincy MA in 2026?
The average Quincy single-family home sold for $856,860 in August 2026, up 12.4% from August 2025. The weighted average across January through August 2026 was $808,934.
Why are fewer homes selling in Quincy this year?
Quincy recorded 181 single-family sales from January through August 2026 versus 243 in the same period of 2025. The drop is driven by a very weak January and February, higher prices pushing out some buyers, and the fact that new inventory did not really arrive until the summer months.
How long do houses take to sell in Quincy MA?
Homes that closed in August 2026 had been on the market an average of 33 days. Homes currently listed and unsold have been sitting 48 days on average, down from 68 days a year earlier.
Is now a good time to sell a house in Quincy?
Pricing is close to record territory and active listings still move quickly, so conditions favor prepared sellers. The caveat is that inventory has climbed 48.6% year over year to 52 homes, so competition among sellers is the highest it has been in this cycle.
Can I sell an inherited house in Quincy without fixing it up?
Yes. Cash buyers such as Bluefin Property Buyers purchase Quincy homes as-is, including inherited and estate properties, with no repairs, no cleanout and no agent commission. You can leave unwanted belongings behind and choose your own closing date.