
July 2026 | MLSPIN Data Pulled 8/4/2026
| ACTIVE LISTINGS 45 +21.6% YoY | HOMES SOLD 36 -25.0% YoY | AVG SOLD PRICE $822,858 +9.7% YoY | MONTHS OF INVENTORY 1.62 vs. 1.06 last July |
July 2026 Snapshot
Quincy’s July 2026 numbers tell an unusual story: fewer homes sold, but for meaningfully more money. Only 36 single-family homes closed in July, down 25% from 48 a year ago – yet the average sold price jumped to $822,858, a 9.7% increase over July 2025’s $750,083. Active inventory grew to 45 listings (up from 37), and homes are moving off the market noticeably faster: active listings now average just 40 days on market, down sharply from 57 days last July.
Year-Over-Year Comparison: July 2026 vs. July 2025
| Metric | July 2025 | July 2026 | YoY Change |
| Active Listings | 37 | 45 | +21.6% |
| Active Avg. List Price | $1,222,872 | $1,188,491 | -2.8% |
| Active Avg. Days on Market | 57 | 40 | -17 days |
| Homes Sold | 48 | 36 | -25.0% |
| Sold Avg. Days on Market | 27 | 26 | -1 day |
| Average Sold Price | $750,083 | $822,858 | +9.7% |
| Sold-to-List Ratio | 103.34% | 102.09% | -1.25 pts |
| Months of Inventory | 1.06 | 1.62 | +0.56 mo. |
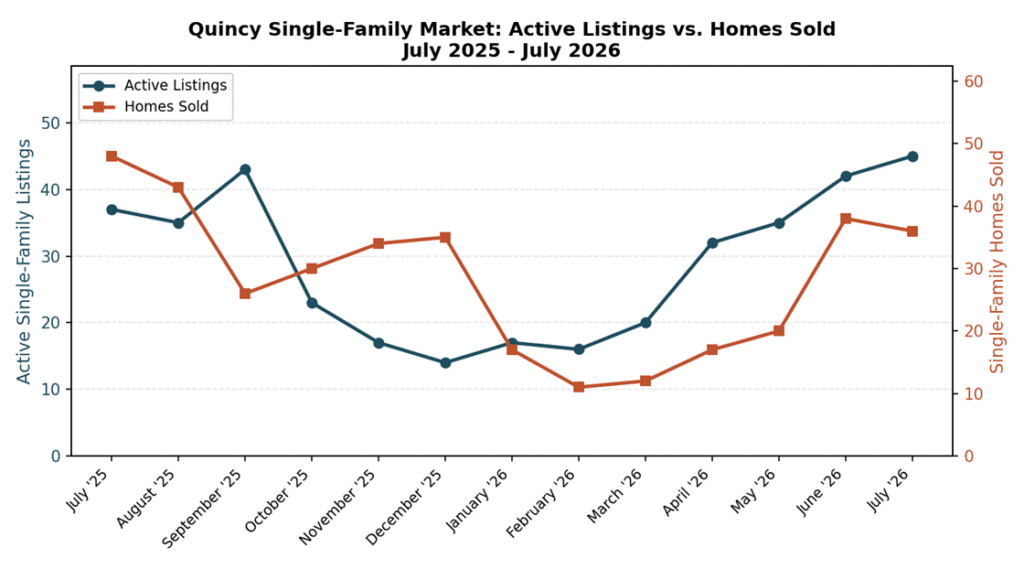
Chart: Quincy active listings vs. homes sold, July 2025-July 2026.
Trend: First Seven Months of 2026
The combination of fewer closings, faster absorption, and rising prices suggests Quincy’s July slowdown in transaction count reflects a thinner pipeline of homes hitting the market earlier in the year rather than softening demand – buyers are still moving quickly on what does list, and paying more to do it. Across March through July, Quincy’s average sold price averaged $789,252, up 6.2% from the same stretch in 2025, even as sold-home volume ran about 20.6% behind last year’s pace (123 sales this year vs. 155). Quincy also remains a seller’s market by the numbers: homes sold for 102.09% of list price in July, and at 1.62 months of supply, the city is still well under the 5-6 month threshold that would signal a buyer’s market.
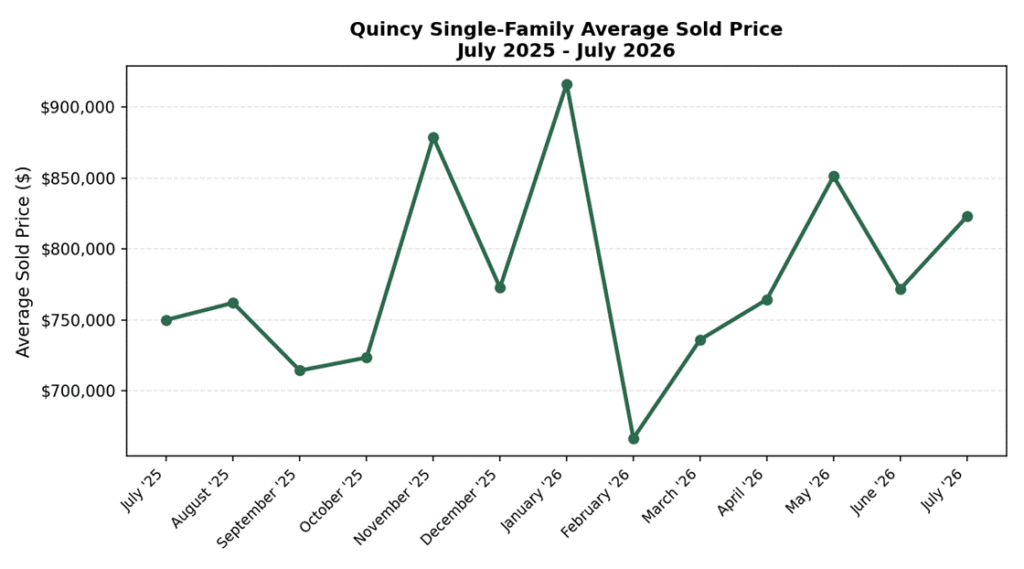
Chart: Quincy average single-family sold price by month, July 2025-July 2026.
What This Means If You’re Thinking About Selling
For Quincy homeowners, this data points to a market that still rewards well-positioned sellers with strong prices – but with a smaller pool of transactions, timing and presentation matter more than they did during the frenzy of the past couple of years. If your Quincy property needs work before it could compete for one of those above-asking offers, or you’d rather not wait through a listing and closing process, Bluefin Property Buyers purchases Quincy single-family homes directly for cash, as-is. You can see how it works and get a no-obligation offer at our We Buy Houses Quincy MA page – because sometimes the easy way out is worth more than chasing the market.
Frequently Asked Questions (FAQs)
What is the average home price in Quincy, MA in 2026?
Quincy’s average single-family sold price was $822,858 in July 2026, up 9.7% from $750,083 in July 2025.
Is it a good time to sell a house in Quincy, MA?
Prices are rising and homes are moving quickly – active listings averaged just 40 days on market in July 2026, down from 57 days a year earlier – so conditions currently favor sellers, especially for move-in-ready homes.
How long does it take to sell a house in Quincy, MA?
Homes that sold in Quincy in July 2026 spent an average of 26 days on market, essentially the same as July 2025’s 27 days.
Are home prices rising in Quincy, Massachusetts?
Yes, Quincy’s average sold price is up 9.7% year-over-year, and the March-July 2026 average was up 6.2% over the same period in 2025.
How much inventory is on the market in Quincy, MA right now?
Quincy had 45 active single-family listings in July 2026, representing about 1.62 months of supply.