
July 2026 | MLSPIN Data Pulled 8/4/2026
Prepared for Bluefin Property Buyers / CashOfferMA.com
| ACTIVE LISTINGS 6,911 +11.8% YoY | HOMES SOLD 4,655 +6.6% YoY | AVG SOLD PRICE $901,402 +1.4% YoY | MONTHS OF INVENTORY 1.83 vs. 1.65 last July |
July 2026 Snapshot
Massachusetts’ single-family market closed out July 2026 with 6,911 active listings statewide, up 11.8% from the 6,183 homes on the market in July 2025. That’s the highest active inventory count the state has seen in this data set going back to last summer, and it caps a steady five-month build since inventory bottomed out at just 3,190 listings in January 2026. More homes changed hands too: 4,655 single-family homes sold in July, a 6.6% increase over July 2025’s 4,367 sales, and essentially flat from June 2026’s 4,631.
Pricing held firm. The average sold price came in at $901,402, up 1.4% year-over-year and only a marginal 0.4% softer than June’s $904,772 – in other words, prices leveled off after the spring run-up rather than reversing. Homes also continued to fetch more than list price on average: the statewide sold-to-list ratio was 101.07%, slightly ahead of last July’s 100.74%, which tells us competitive, above-ask offers are still very much part of the picture even with more inventory to choose from.
The one metric moving in the seller-cautionary direction is pace: the average sold home spent 34 days on market in July, up from 31 days a year ago, and active listings now average 70 days on market versus 69 last July. It’s a small shift, but combined with the double-digit rise in inventory, it points to a market that is loosening from an extremely tight seller’s market toward a more balanced one – still favorable to sellers, but no longer quite as frantic as it was twelve months ago.
Year-Over-Year Comparison: July 2026 vs. July 2025
| Metric | July 2025 | July 2026 | YoY Change |
| Active Listings | 6,183 | 6,911 | +11.8% |
| Active Avg. List Price | $1,424,347 | $1,342,861 | -5.7% |
| Active Avg. Days on Market | 69 | 70 | +1 day |
| Homes Sold | 4,367 | 4,655 | +6.6% |
| Sold Avg. Days on Market | 31 | 34 | +3 days |
| Average Sold Price | $889,245 | $901,402 | +1.4% |
| Average List Price (sold homes) | $882,724 | $891,895 | +1.0% |
| Sold-to-List Ratio | 100.74% | 101.07% | +0.33 pts |
| Months of Inventory | 1.65 | 1.83 | +0.18 mo. |
Note: the active-list-price figure is a snapshot of what’s currently sitting on the market, not what’s selling. Its year-over-year dip mainly reflects the mix of homes listed this July rather than a broad repricing – the average sold price, which reflects what buyers actually paid, is still up 1.4% over the same period.
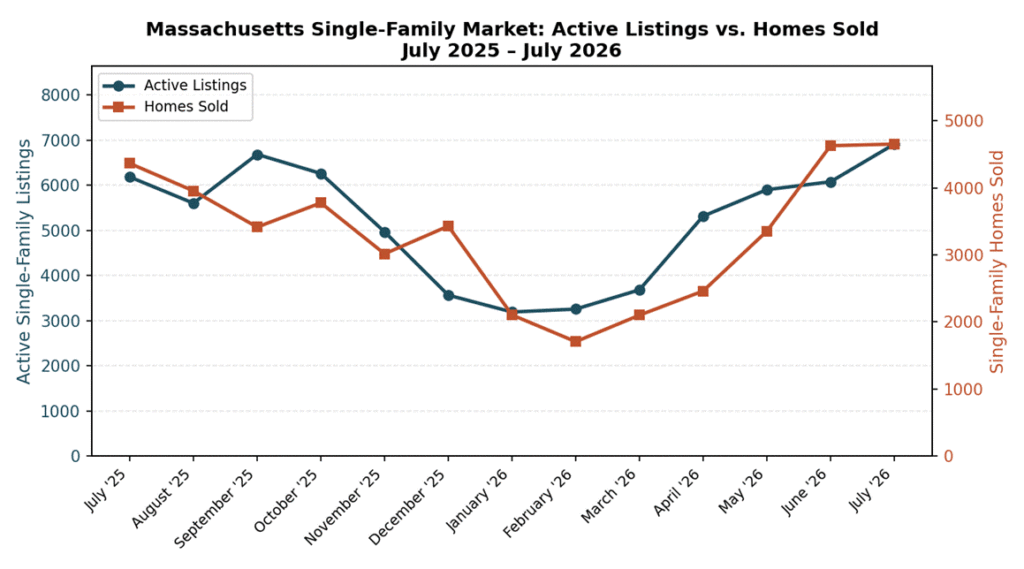
Chart 1: Massachusetts active listings vs. homes sold, July 2025-July 2026. Alt text: “Line chart comparing Massachusetts single-family active listings and homes sold each month from July 2025 to July 2026, showing inventory rising sharply from a January 2026 low of 3,190 to 6,911 in July 2026 while monthly sales climbed from 2,105 in January to 4,655 in July.”
First Seven Months of 2026: The Bigger Trend
Zooming out from any single month, the first seven months of 2026 (January through July) tell a clear story of a market re-inflating after a slow winter. Statewide, 21,015 single-family homes sold across those seven months. Sales started 2026 sluggishly – just 2,105 homes sold in January and a low of 1,706 in February, likely a combination of typical winter seasonality and thin inventory – then accelerated steadily each month through the spring and summer, peaking at 4,655 sales in July.
Inventory followed a similar arc but with a longer runway: active listings bottomed at 3,190 in January 2026 and more than doubled by July, to 6,911. That’s a healthy sign for buyers who have been frustrated by thin selection over the past couple of years, and it’s part of why days-on-market has crept up modestly even as sales volume grew – there’s simply more competition among listings for buyers’ attention.
Comparing the five overlapping months where we have full year-ago data (March-July), 2026 and 2025 sales volume are nearly identical – 17,204 homes sold in the 2026 window versus 17,162 in the same months of 2025, a difference of just 0.2%. But pricing tells a different story: the average sold price across that same March-July window rose from $872,087 in 2025 to $895,898 in 2026, a 2.7% increase, while average days-on-market to sell stretched from 35.6 to 40.2 days. Put simply, roughly the same number of Massachusetts single-family homes are trading hands as this time last year, but at meaningfully higher prices and with a bit more patience required to get a deal done.
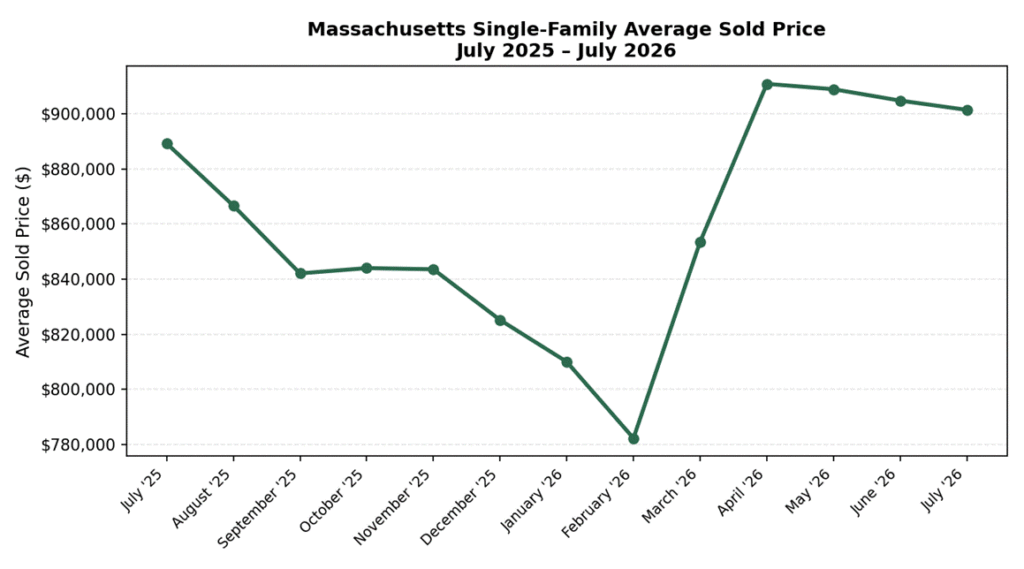
Chart 2: Massachusetts average single-family sold price by month, July 2025-July 2026. Alt text: “Line chart of Massachusetts single-family average sold price from July 2025 ($889,245) through July 2026 ($901,402), showing a winter dip to $782,290 in February 2026 followed by a sharp spring rebound to over $900,000 by April 2026 and stable pricing through summer.”
What’s Driving It
- Inventory recovery: after nearly two years of historically tight supply, more Massachusetts homeowners are listing, giving buyers more to choose from and easing some of the extreme urgency that defined 2023-2025.
- Price resilience, not a correction: despite the inventory jump, average sold prices are still up both month-over-month direction and year-over-year – buyers are absorbing the added supply rather than driving prices down.
- Modest pace slowdown: days-on-market ticked up on both the active and sold sides, a natural byproduct of buyers having more options to compare before committing.
- Still a seller-favorable market: at 1.83 months of supply, Massachusetts remains well under the 5-6 months that typically defines a balanced market, and homes are still selling above list price on average.
What This Means If You’re Thinking About Selling
For homeowners weighing a traditional listing, July’s data cuts both ways. On one hand, prices are holding up and homes are still selling above asking on average – good news if your property shows well and you can afford to wait out a 34-day (or longer) marketing and closing timeline in a market with more competing listings than a year ago. On the other hand, rising inventory means your home is no longer the only option in front of buyers, and the days-on-market creep suggests the days of guaranteed multiple offers in the first weekend are less certain than they were twelve months ago – particularly for homes that need work, are priced aggressively, or sit in a slower-moving price tier.
That’s exactly the situation where a lot of Massachusetts homeowners start weighing a cash sale without inspection instead of the traditional listing process – especially if the property needs repairs, there’s a tight timeline (inherited property, relocation, avoiding foreclosure, or simply not wanting to deal with showings and financing contingencies), or you’d rather have certainty than chase a market that’s shifting month to month.
That’s where Bluefin Property Buyers comes in. We buy Massachusetts single-family homes directly, as-is, for cash – no repairs, no staging, no financing fall-throughs, and no 34-plus days waiting to see if a buyer’s mortgage clears. If you’d rather skip the uncertainty of today’s shifting market and get a straightforward, no-obligation cash offer, visit our statewide Massachusetts page to see how it works. As we always say: take the easy way out.
Source: MLSPIN single-family market data, statewide Massachusetts, pulled 8/4/2026. Figures reflect single-family homes only and are subject to revision as additional MLS data is reported.
Frequently Asked Questions (FAQs)
What is the average home price in Massachusetts in July 2026?
The average sold price for single-family homes in Massachusetts was $901,402 in July 2026, up 1.4% from $889,245 in July 2025, according to MLSPIN data.
Is Massachusetts still a seller’s market in 2026?
Yes. With 1.83 months of inventory statewide in July 2026, Massachusetts remains well under the 5-6 months that typically defines a balanced market, and homes are still selling for about 101% of list price on average.
How many days does it take to sell a house in Massachusetts in 2026?
Statewide, single-family homes that sold in July 2026 spent an average of 34 days on market, up slightly from 31 days in July 2025.
Are home prices going up or down in Massachusetts in 2026?
Prices are up modestly. The average sold price rose 1.4% year-over-year in July 2026, and across March-July 2026 the average sold price was up 2.7% compared to the same months in 2025.
Should I sell my house now or wait in Massachusetts?
With inventory up 11.8% year-over-year but prices still rising and homes still selling above asking on average, current conditions favor sellers, though the market has cooled slightly from the intensity of the past couple of years. A licensed local advisor – or comparing a cash offer against a traditional listing – can help you weigh timing for your specific situation.