
West Bridgewater is one of the smallest housing markets in Plymouth County — a rural, tight-knit community along Route 24 known for its farmland, the Nunckatessett Greenway, and a housing stock heavy on classic New England homes. Because so few homes change hands here in any given month, West Bridgewater’s market data behaves differently than a larger town’s. A single high-end sale or a single home that lingers can swing the averages dramatically — and that’s exactly what happened in the first half of 2026.
A Market of Extremes
Monthly closed sales in West Bridgewater ranged from just 2 to 5 homes throughout the first half of 2026 — a small enough sample that a single unusual transaction can move the average significantly. And move it did:
- January: 5 homes sold at an average price of $475,000
- March: only 4 homes sold, but the average jumped to $679,000
- May: 4 homes sold, average back down to $483,000
- June: just 2 homes sold, and the average spiked to $910,000
That June figure isn’t a sign the market suddenly doubled in value — it’s what happens when only two sales make up the entire month’s data and one of them was a higher-end property. It’s a good reminder that in a market this size, a single “average price” headline can be misleading without the context of how many homes that average is actually built on.
West Bridgewater average sold price vs. average active list price, Jan–Jun 2026. Note the persistent gap between what’s listed and what actually sells.
The Gap Between What’s Listed and What Actually Sells
One of the more telling trends in West Bridgewater is the gap between active list prices and sold prices. Average active list prices sat near or above the $1 million mark for most of the spring — peaking at $1,099,166 in April — while actual sold prices stayed in the $480,000 to $680,000 range in every month except June.
That gap suggests two different tiers of activity happening at once: a handful of higher-priced homes sitting on the market waiting for the right buyer, while more moderately priced homes are the ones actually closing. If you’re pricing a West Bridgewater home based on what similar houses are listed for rather than what they’ve actually sold for, you may be aiming higher than current buyer behavior supports.
Days on Market Tell Their Own Story
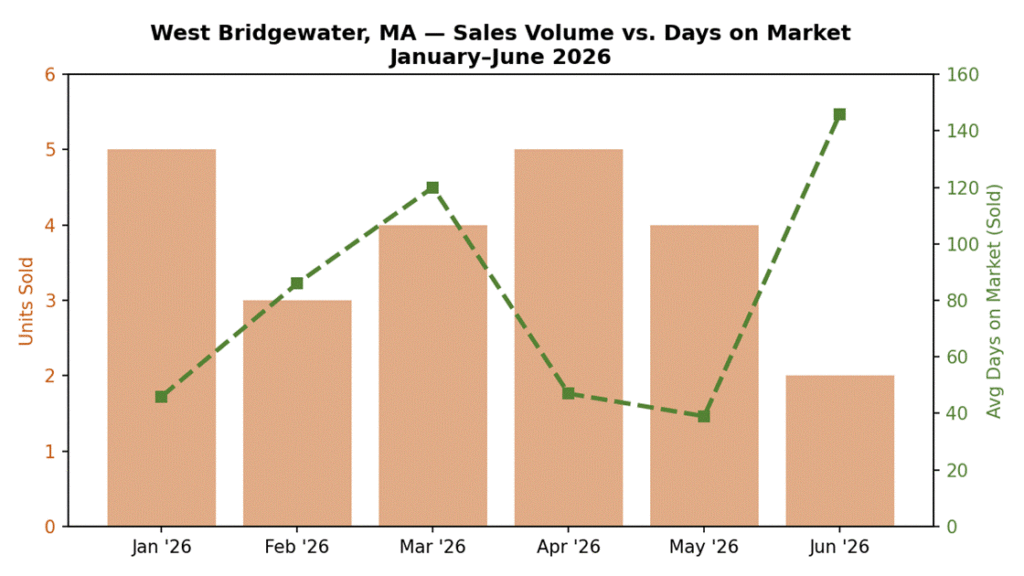
Average days on market for sold homes swung even more dramatically than price: 46 days in January, 86 in February, a striking 120 days in March, then a snap-back to just 47 days in April and 39 days in May — before stretching back out to 146 days in June, the longest stretch of the year.
Swinging from 39 days to 146 days in the span of two months is a hallmark of a thin, low-volume market. It usually isn’t a sign of changing buyer demand town-wide — it’s what happens when each month’s small handful of sales includes a mix of move-in-ready homes that go quickly and unique or higher-priced properties that take much longer to find the right match.
West Bridgewater units sold (bars) vs. average days on market for sold homes (line), Jan–Jun 2026.
Zooming Out: How This Compares to Massachusetts
Statewide, Massachusetts months of inventory climbed in a fairly smooth line from 1.04 in January 2026 to 2.45 in June, as active listings nearly doubled from 3,563 to 5,901. It was a gradual, predictable loosening of supply.
West Bridgewater didn’t follow that clean pattern. Its months of inventory bounced between 1.89 and 2.86 without a clear direction, and active listings never climbed past 10 in any single month all year. That’s the clearest evidence that West Bridgewater isn’t really a “trend” market in the way Massachusetts as a whole is — it’s a market made up of individual, one-off transactions, where the story of any given month has more to do with which specific homes happened to sell than with broad economic conditions.
What This Means for West Bridgewater Sellers
In a market this thin, timing and buyer pool can matter more than the broader headlines. A home that hits the market during a slow stretch — like the 146-day average in June — can end up waiting far longer than a seller planned for, simply because there are so few active buyers shopping in town at any given moment. If you’re on a deadline, whether it’s a job relocation, an inherited property, or simply wanting to move on, waiting for “the right buyer” in a market this unpredictable is a real risk.
Sell Your Massachusetts House Fast!
We buy houses in Massachusetts in ANY CONDITION! Get a CASH offer with no commissions, agents, or hidden fees. Just enter your property address, phone, and email below, and you could receive your cash offer within 24 hours!
Thinking About Selling in West Bridgewater?
Market data can tell you a lot about pricing and timing, but it can’t tell you what your specific house, your specific timeline, and your specific situation call for. If a slow-moving buyer pool, financing fall-throughs, or the thought of months of showings doesn’t sound appealing, there’s another option. Bluefin Property Buyers buys houses throughout Massachusetts in as-is condition, for cash, on a timeline that works for you — no repairs, no staging, no waiting on a buyer’s mortgage approval, and no commissions.
As we always say: Take the easy way out.
Curious what your West Bridgewater property is really worth in cash, as-is, no obligation? Get your free cash offer for your West Bridgewater home here, or explore what we’re seeing across Massachusetts as a whole.
Is West Bridgewater, MA a buyer’s or seller’s market in 2026?
It leans toward a seller’s market on paper — months of inventory stayed under 3.0 all year, well below the 5-to-6-month benchmark for a balanced market — but with so few homes selling each month (2 to 5), conditions can feel very different from one listing to the next.
Why do home prices vary so much in West Bridgewater?
Because so few homes sell each month, the average sold price is easily swayed by just one or two transactions. A single higher-end sale, like the one behind June 2026’s $910,000 average on only 2 closed sales, can move the monthly average far more than it would in a larger town.
How long are homes sitting on the market in West Bridgewater in 2026?
It’s been inconsistent. Average days on market for sold homes ranged from a low of 39 days in May 2026 to a high of 146 days in June 2026, reflecting the mix of quick sales and slower-moving, unique properties typical of a small market.
What is the average home price in West Bridgewater, MA?
Excluding the outlier-driven June figure, average sold prices in West Bridgewater generally ranged from about $475,000 to $679,000 during the first half of 2026, even though average active list prices were frequently listed near or above $1,000,000.
Can I sell my West Bridgewater house fast without dealing with a slow, unpredictable listing?
Yes. Because West Bridgewater’s buyer pool is so small, a traditional listing can mean waiting weeks or months for the right match. A direct cash sale skips that uncertainty — no waiting on the right buyer to show up, no financing contingencies, and a closing date you control.