
July 2026 | MLSPIN Data Pulled 8/4/2026
| ACTIVE LISTINGS 24 -31.4% YoY | HOMES SOLD 14 +27.3% YoY | AVG SOLD PRICE $869,089 -0.4% YoY | MONTHS OF INVENTORY 2.09 vs. 4.00 last July |
July 2026 Snapshot
Hull is a market with its own personality – as one of the only South Shore towns in this report where homes are still selling below asking price on average, its coastal, higher-price-point inventory tends to move to a different rhythm than the rest of the South Shore. In July 2026, homes sold for 96.31% of list price, down from 98.07% a year ago, and both figures remain below the 100%+ ratios in most other South Shore towns.
Year-Over-Year Comparison: July 2026 vs. July 2025
| Metric | July 2025 | July 2026 | YoY Change |
| Active Listings | 35 | 24 | -31.4% |
| Active Avg. List Price | $1,042,725 | $1,117,352 | +7.2% |
| Active Avg. Days on Market | 80 | 80 | flat |
| Homes Sold | 11 | 14 | +27.3% |
| Sold Avg. Days on Market | 53 | 51 | -2 days |
| Average Sold Price | $872,818 | $869,089 | -0.4% |
| Sold-to-List Ratio | 98.07% | 96.31% | -1.76 pts |
| Months of Inventory | 4.00 | 2.09 | -1.91 mo. |
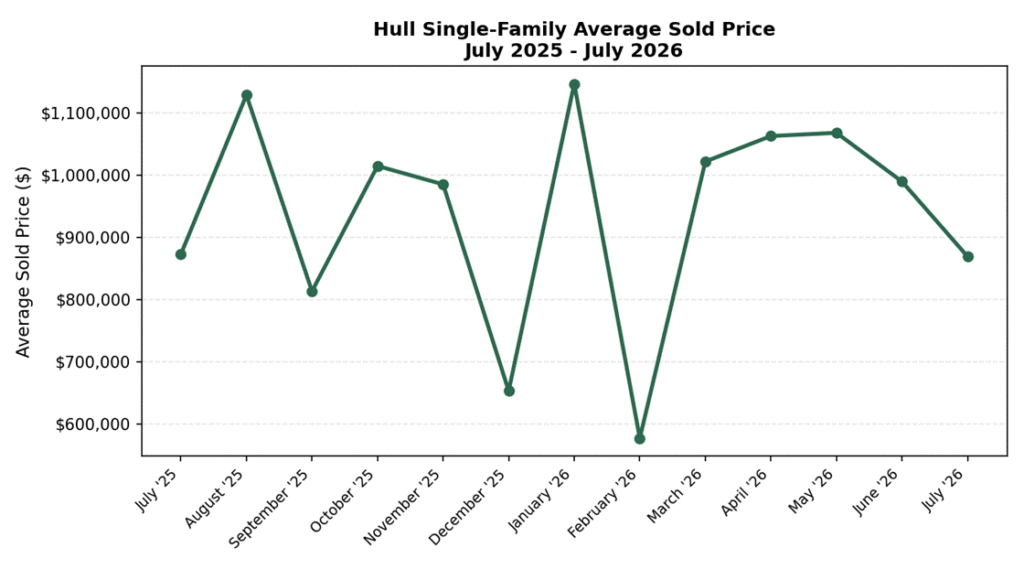
Chart: Hull active listings vs. homes sold, July 2025-July 2026.
Trend: First Seven Months of 2026
That said, Hull’s inventory picture tightened considerably: months of supply fell from 4.00 a year ago to 2.09 in July 2026, as active listings dropped 31.4% (from 35 to 24) while sales rose 27.3% (11 to 14 homes). The average sold price held essentially steady at $869,089, down just 0.4% from $872,818 a year ago – but zooming out to the March-through-July window, Hull’s average sold price was actually up 22.3% year-over-year ($1,002,084 vs. $819,588), pointing to a notable shift toward higher-value sales – likely waterfront or larger properties – earlier in the summer season even as July itself came in closer to last year’s level. Days on market for sold homes remains long relative to other towns in this report, at 51 days, consistent with Hull’s slower-moving, higher-price-point segment.
Chart: Hull average single-family sold price by month, July 2025-July 2026.
What This Means If You’re Thinking About Selling
For Hull homeowners, this is a market where patience and pricing strategy matter more than in the faster-moving towns in this report – homes here typically take longer to sell and sometimes settle below asking. If you’d rather bypass that longer marketing timeline, especially for a property that needs updating to compete in the coastal luxury segment, Bluefin Property Buyers can make a direct cash offer on your Hull home as-is. Learn more at our We Buy Houses for Cash in Hull MA page and take the easy way out.
Frequently Asked Questions (FAQs)
What is the average home price in Hull, MA in 2026?
Hull’s average single-family sold price was $869,089 in July 2026, essentially flat compared to $872,818 in July 2025.
Do homes in Hull, MA sell below asking price?
Often, yes – Hull’s average sold-to-list ratio was 96.31% in July 2026, one of the only towns in this data set where homes typically sell below their asking price.
How long does it take to sell a house in Hull, MA?
Homes that sold in Hull in July 2026 averaged 51 days on market, among the longer timelines in this report, reflecting its higher-priced coastal inventory.
Is Hull, MA a buyer’s or seller’s market in 2026?
Inventory has tightened significantly, from 4.00 months of supply a year ago to 2.09 months in July 2026, but with homes still selling below asking on average, buyers retain some negotiating leverage.
Is now a good time to sell a coastal home in Hull, MA?
With inventory down 31.4% year-over-year and sales up 27.3%, conditions have improved for sellers, though patience and realistic pricing remain important given Hull’s longer average time on market.