
July 2026 | MLSPIN Data Pulled 8/4/2026
| ACTIVE LISTINGS 16 +45.5% YoY | HOMES SOLD 8 -46.7% YoY | AVG SOLD PRICE $624,125 +8.8% YoY | MONTHS OF INVENTORY 1.83 vs. 0.98 last July |
July 2026 Snapshot
Holbrook shows a pattern similar to Quincy’s this July: a notable drop in the number of homes sold, alongside rising prices and faster-moving transactions. Just 8 single-family homes sold in July 2026, down 46.7% from 15 a year ago – but the average sold price rose to $624,125, an 8.8% increase over July 2025’s $573,714, and the homes that did sell moved quickly, averaging just 26 days on market versus 38 a year ago.
Year-Over-Year Comparison: July 2026 vs. July 2025
| Metric | July 2025 | July 2026 | YoY Change |
| Active Listings | 11 | 16 | +45.5% |
| Active Avg. List Price | $710,217 | $623,824 | -12.2% |
| Active Avg. Days on Market | 50 | 42 | -8 days |
| Homes Sold | 15 | 8 | -46.7% |
| Sold Avg. Days on Market | 38 | 26 | -12 days |
| Average Sold Price | $573,714 | $624,125 | +8.8% |
| Sold-to-List Ratio | 102.51% | 102.17% | -0.34 pts |
| Months of Inventory | 0.98 | 1.83 | +0.85 mo. |
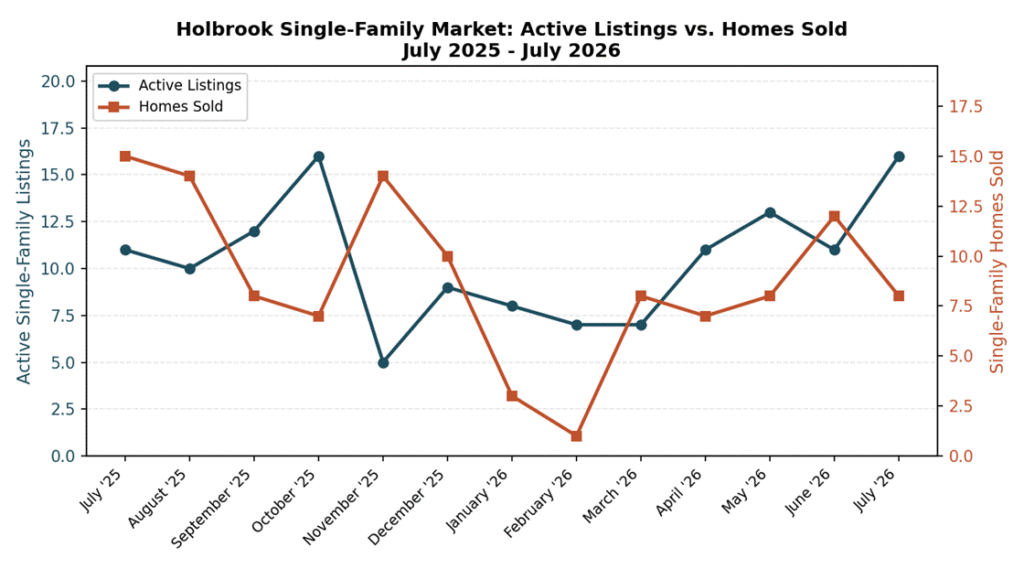
Chart: Holbrook active listings vs. homes sold, July 2025-July 2026.
Trend: First Seven Months of 2026
Active inventory grew substantially, up 45.5% to 16 listings from 11, pushing months of supply from 0.98 to 1.83 – still a tight market by conventional standards, but a meaningfully looser one than a year ago when Holbrook had well under a month of supply. Looking at the broader Jan-Jul 2026 window, 47 homes sold total, and the March-through-July figures show a smaller year-over-year sales dip (43 homes vs. 48, down 10.4%) than July’s standalone number suggests – indicating July’s sharp drop is more of a single-month dip than a sustained trend. Homes are still selling right around list price, at 102.17% of asking.
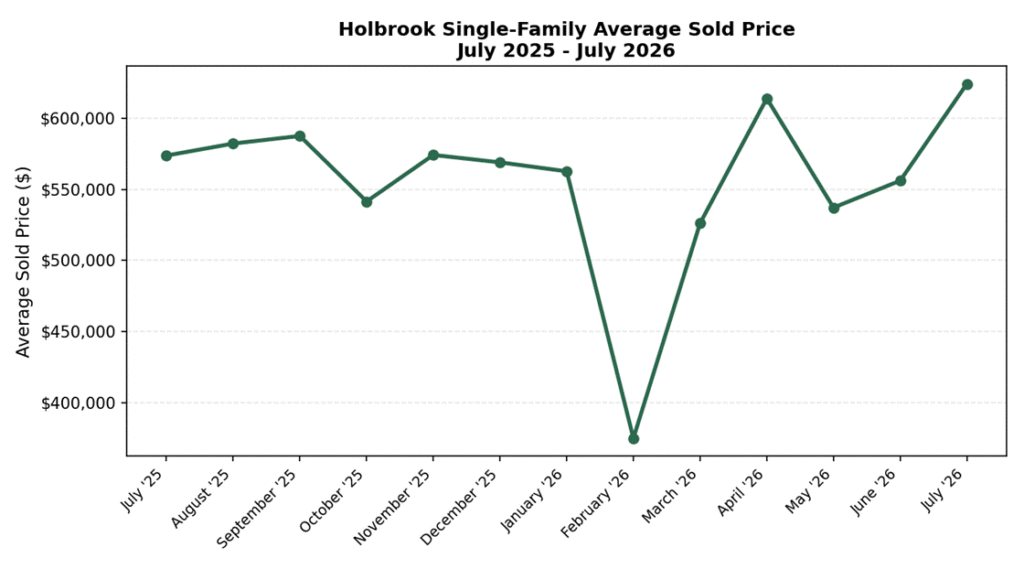
Chart: Holbrook average single-family sold price by month, July 2025-July 2026.
What This Means If You’re Thinking About Selling
For Holbrook homeowners, the combination of rising prices and thinner July sales volume means good news on value but a market that’s becoming a bit more selective about which homes move quickly. If your home needs updates to compete for one of those 26-day sales, or you’d prefer certainty over waiting to see how the fall market shapes up, Bluefin Property Buyers can make a direct cash offer on your Holbrook property as-is. Visit our We Buy Houses for Cash in Holbrook MA page to learn more – take the easy way out.
Frequently Asked Questions (FAQs)
What is the average home price in Holbrook, MA in 2026?
Holbrook’s average single-family sold price was $624,125 in July 2026, up 8.8% from $573,714 in July 2025.
Is Holbrook, MA a good market to sell a house in?
Prices are rising and homes that sell move quickly (26 days on market on average), though July 2026 saw fewer total sales than a year earlier, suggesting the market has become more selective.
How fast are homes selling in Holbrook, MA?
Homes that sold in Holbrook in July 2026 averaged 26 days on market, down from 38 days in July 2025.
How much housing inventory is available in Holbrook, MA?
Holbrook had 16 active single-family listings in July 2026, up 45.5% from 11 a year earlier, representing 1.83 months of supply.
Is it a good time to sell a house in Holbrook, MA?
Rising prices and fast sale times favor sellers with move-in-ready homes, though the drop in July sales volume suggests buyers have become somewhat more selective than a year ago.