
East Bridgewater is a quiet, pond-dotted Plymouth County town along Route 18, close enough to Brockton and Route 24 for an easy commute but still holding onto its rural New England character. That mix of accessibility and small-town feel usually makes for a fairly predictable housing market. The first half of 2026, however, has been anything but predictable — supply has been historically tight, but the pace at which homes are actually selling has told a very different story.
A Market That Started Bone-Dry
Looking at the numbers from January through June 2026, the defining feature of East Bridgewater’s market has been just how little was available to buy for much of the winter and early spring:
- January 2026: just 5 active listings and only 0.53 months of supply — essentially nothing on the shelf. For reference, real estate professionals generally consider 5 to 6 months of inventory a balanced market.
- April 2026: active listings climbed to 10 and months of supply reached 2.00, the loosest point of the first half — though still well inside seller’s-market territory.
- June 2026: supply tightened again to 7 listings and 1.17 months of inventory.
In short, buyers in East Bridgewater spent nearly all of the first half of 2026 with very few homes to choose from.
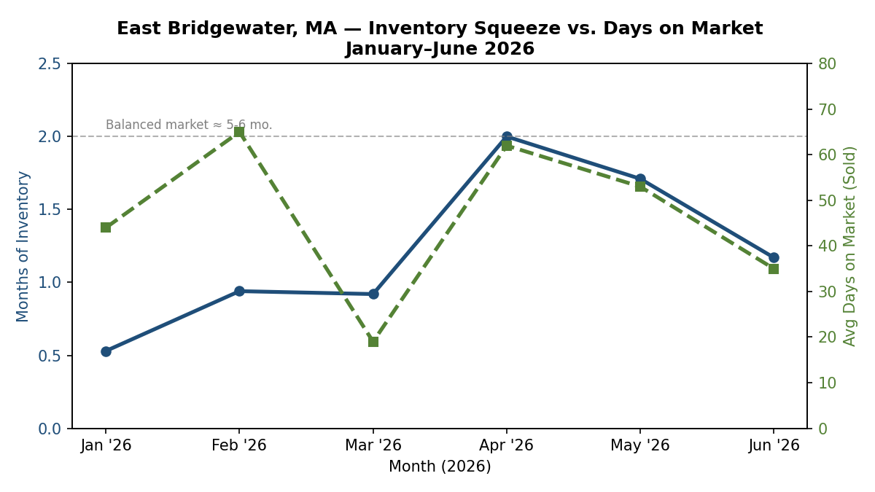
East Bridgewater months of inventory (left axis) alongside average days on market for sold homes (right axis), Jan–Jun 2026.
Prices Held Steady — But the Sales Process Slowed Down
Despite the inventory squeeze, average sold prices in East Bridgewater stayed in a fairly tight band all winter and spring — from a low of $559,167 in May to a high of $647,667 in June. There wasn’t a runaway price spike, which on its own would suggest a calm, orderly market.
What stands out instead is how long it took sold homes to actually get under agreement. Average days on market for sold properties bounced from 44 days in January to 65 in February, dropped sharply to just 19 days in March, then climbed back up to 62 days in April and 53 days in May before settling at 35 days in June.
That April and May stretch is the real story. Compared to the same months in 2025 — 34 days on market in April and just 20 days in May — this year’s homes sat roughly 80% to 165% longer before going under agreement, even though there were technically fewer homes competing for buyers’ attention. In a market this tight, that kind of hesitation usually points to buyers being more selective, more sensitive to financing costs, or simply slower to pull the trigger on the wrong house — not a lack of demand.
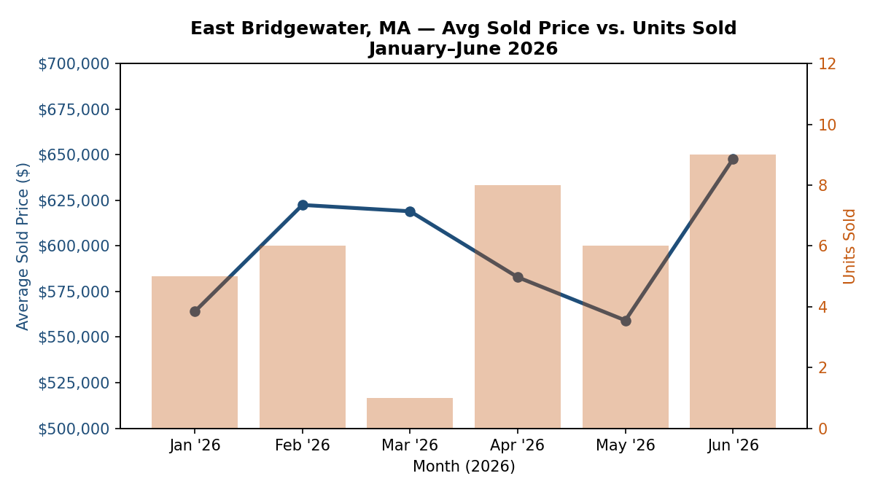
East Bridgewater average sold price (line) vs. units sold (bars), Jan–Jun 2026.
How East Bridgewater Stacks Up Against Massachusetts
The statewide picture gives useful context. Across Massachusetts as a whole, inventory followed a similar tight-winter, looser-spring arc — months of supply started at just 1.04 in January 2026 and climbed to 2.45 by June as active listings nearly doubled, from 3,563 to 5,901.
But statewide, competition for the homes that were available actually intensified as the year went on — the average sold-to-list price ratio rose from 98.58% in January to 101.23% by June, meaning more homes were fetching bidding-war premiums in June than in January, even with more inventory on the market.
East Bridgewater’s inventory trend tracks the state closely. But its buyer behavior doesn’t — the lengthening days-on-market in April and May run counter to a state that was, if anything, getting more competitive. That’s a hyperlocal wrinkle worth knowing if you’re pricing a home here: what’s true for Massachusetts overall isn’t automatically true on your street.
What This Means If You’re Thinking About Selling
Thin inventory is generally good news for sellers — less competition on the shelf. But the longer days-on-market trend means pricing strategy and first impressions matter more than they might have a year ago. An overpriced or under-prepared listing in a market where buyers are already taking their time can end up sitting far longer than expected, racking up carrying costs while you wait.
If your home needs work, if your timeline doesn’t have room for an unpredictable number of showings and negotiations, or if you’d simply rather skip the uncertainty altogether, a traditional listing isn’t the only path forward.
Sell Your Massachusetts House Fast!
We buy houses in Massachusetts in ANY CONDITION! Get a CASH offer with no commissions, agents, or hidden fees. Just enter your property address, phone, and email below, and you could receive your cash offer within 24 hours!
Thinking About Selling in East Bridgewater?
Market data can tell you a lot about pricing and timing, but it can’t tell you what your specific house, your specific timeline, and your specific situation call for. If a slow-moving buyer pool, financing fall-throughs, or the thought of months of showings doesn’t sound appealing, there’s another option. Bluefin Property Buyers buys houses throughout Massachusetts in as-is condition, for cash, on a timeline that works for you — no repairs, no staging, no waiting on a buyer’s mortgage approval, and no commissions.
As we always say: Take the easy way out.
Curious what your East Bridgewater property is really worth in cash, as-is, no obligation? Get your free cash offer for your East Bridgewater home here, or explore what we’re seeing across Massachusetts as a whole.
Is East Bridgewater, MA a seller’s market in 2026?
Yes. Months of inventory stayed below 2.0 for five of the first six months of 2026, and hit an extreme low of 0.53 in January. Anything under roughly 5 to 6 months of supply is generally considered favorable to sellers, so East Bridgewater has been solidly in seller’s-market territory for most of the year.
How long does it take to sell a house in East Bridgewater right now?
It varies month to month. Sold homes averaged 35 days on market in June 2026, but that number ranged from as little as 19 days in March to as much as 65 days in February during the first half of the year. Compared to 2025, homes have generally been taking longer to reach an accepted offer in 2026.
What is the average home sale price in East Bridgewater in 2026?
Through the first six months of 2026, the average sold price in East Bridgewater ranged from about $559,000 in May to about $648,000 in June, without a dramatic spike in either direction.
Why are homes in East Bridgewater taking longer to sell despite low inventory?
Low inventory typically speeds up sales, but East Bridgewater’s average days on market actually lengthened in April and May 2026 compared to the same months in 2025. That pattern usually points to more cautious or price-sensitive buyers — often tied to financing costs — rather than a genuine drop in demand.
Is now a good time to sell my house in East Bridgewater without listing it traditionally?
With buyers moving more slowly this year, a traditional listing means less certainty about how long your home will sit or how many showings you’ll host. If predictability matters more to you than testing the top of the market, a direct cash sale can remove that uncertainty entirely — you get an offer, a closing date, and skip the showings altogether.