
July 2026 | MLSPIN Data Pulled 8/4/2026
| ACTIVE LISTINGS 14 -6.7% YoY | HOMES SOLD 13 +62.5% YoY | AVG SOLD PRICE $637,846 +13.0% YoY | MONTHS OF INVENTORY 1.33 vs. 1.94 last July |
July 2026 Snapshot
East Bridgewater is bucking the statewide trend of loosening inventory. While Massachusetts overall saw months-of-supply rise year-over-year, East Bridgewater’s tightened, dropping from 1.94 months last July to 1.33 months this July – meaning homes here are, if anything, getting scarcer relative to demand, not more plentiful. Sales jumped 62.5%, from 8 homes in July 2025 to 13 in July 2026, even as active listings held essentially flat (15 vs. 14).
Year-Over-Year Comparison: July 2026 vs. July 2025
| Metric | July 2025 | July 2026 | YoY Change |
| Active Listings | 15 | 14 | -6.7% |
| Active Avg. List Price | $659,900 | $837,371 | +26.9% |
| Active Avg. Days on Market | 45 | 51 | +6 days |
| Homes Sold | 8 | 13 | +62.5% |
| Sold Avg. Days on Market | 24 | 23 | -1 day |
| Average Sold Price | $564,500 | $637,846 | +13.0% |
| Sold-to-List Ratio | 102.18% | 101.82% | -0.36 pts |
| Months of Inventory | 1.94 | 1.33 | -0.61 mo. |
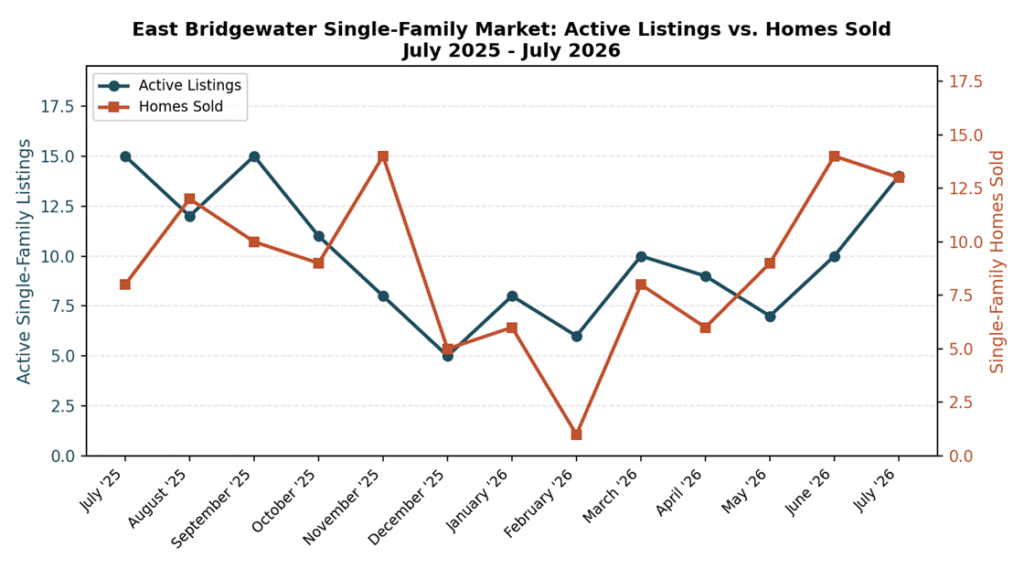
Chart: East Bridgewater active listings vs. homes sold, July 2025-July 2026.
Trend: First Seven Months of 2026
Pricing moved up accordingly: the average sold price reached $637,846 in July, a 13.0% increase over last year’s $564,500. What’s notable is what’s sitting on the market versus what’s actually selling – the average list price of active homes jumped 26.9% year-over-year to $837,371, well above the average sold price, suggesting either a shift toward larger or more updated homes coming to market, or sellers testing higher price points than the town has recently supported. Over the broader March-through-July window, sales volume was up sharply (50 homes in 2026 vs. 35 in 2025, a 42.9% increase), while average sold price during that same window was essentially flat to slightly softer year-over-year – suggesting the July price jump reflects a specific, higher-value sale or two rather than a broad market shift.
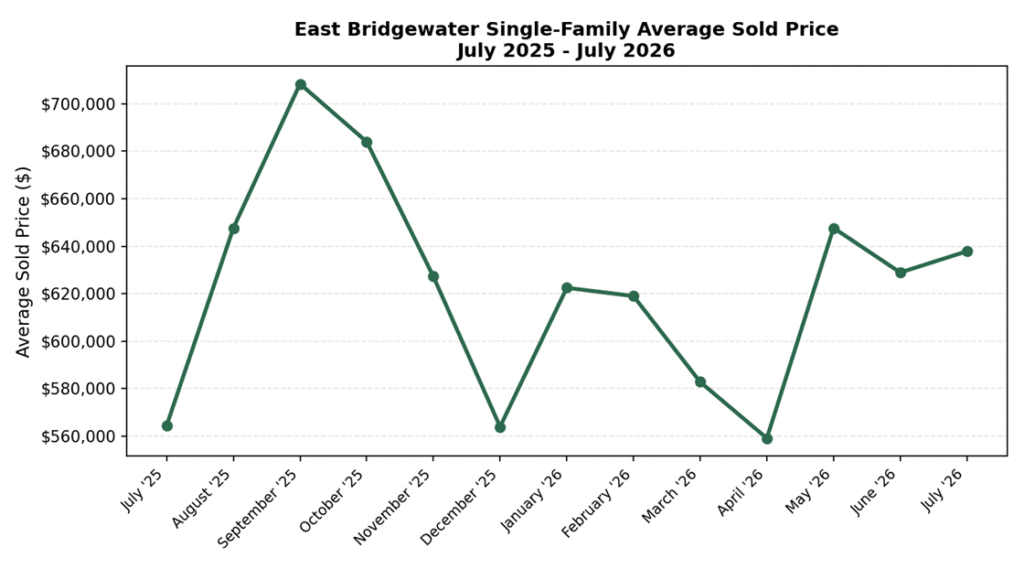
Chart: East Bridgewater average single-family sold price by month, July 2025-July 2026.
What This Means If You’re Thinking About Selling
East Bridgewater’s rising sales pace against tightening inventory is good news if you’re planning to list – but the sold-price data suggests it’s worth being realistic about pricing relative to what’s actually closing, not just what’s listed. If you’d rather skip pricing guesswork and the marketing timeline altogether, Bluefin Property Buyers can make a direct, no-obligation cash offer on your East Bridgewater home as-is. Get the details at our We Buy Houses East Bridgewater MA page and take the easy way out.
Frequently Asked Questions
What is the average home price in East Bridgewater, MA?
East Bridgewater’s average single-family sold price was $637,846 in July 2026, up 13.0% from $564,500 in July 2025.
Is East Bridgewater, MA a seller’s market in 2026?
Yes – inventory tightened to 1.33 months of supply in July 2026, down from 1.94 months a year earlier, even as sales rose 62.5%.
How many homes sold in East Bridgewater, MA in July 2026?
13 single-family homes sold in East Bridgewater in July 2026, up from 8 in July 2025.
How much inventory is available in East Bridgewater right now?
East Bridgewater had 14 active single-family listings in July 2026, representing 1.33 months of supply.
Is it a good time to sell a house in East Bridgewater, MA?
With sales up sharply and inventory tightening, conditions favor sellers – though the gap between active list prices and actual sold prices suggests it’s worth pricing realistically rather than testing the top of the market.