
Home to Bridgewater State University and a walkable downtown along Central Square, Bridgewater has long been one of Plymouth County’s steadier housing markets — a mix of college-town energy and family neighborhoods that tends to draw consistent buyer interest. The first half of 2026 leaned into that reputation, but with a pricing trend that’s worth paying close attention to if you own a home here.
Prices Climbed Nearly 20% in Six Months
The headline number out of Bridgewater’s first-half data is price growth. The average sold price started 2026 at $594,179 in January and closed the first half at $711,607 in June — an increase of nearly 20% in just six months. That’s not a straight line up, either: prices dipped to $625,618 in May before jumping again in June, which tells us buyers were still willing to stretch for the right home even after a brief pullback.
- January 2026: $594,179 average sold price, 13 homes sold
- April 2026: $712,528 average sold price, 17 homes sold — the busiest month of the half
- June 2026: $711,607 average sold price, 16 homes sold
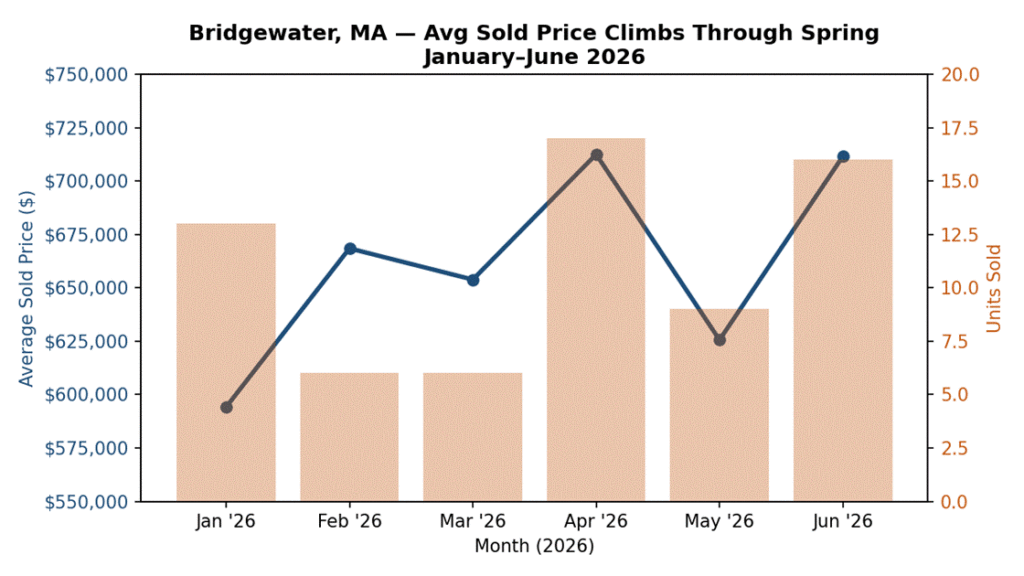
Bridgewater average sold price (line) vs. units sold (bars), Jan–Jun 2026.
A Market That Sped Up as Spring Went On
Compare 2026 to the same months in 2025 and a clear pattern emerges: Bridgewater’s market got faster as the year progressed. Homes that sold in May 2026 averaged just 16 days on market — down from 65 days in May 2025. June 2026 sold homes averaged 22 days, less than half of June 2025’s 52-day average.
February was the outlier of the half — sold homes that month averaged 102 days on market, the slowest stretch of the year, before the market snapped back into a much faster rhythm by spring. Combined with rising months of inventory (from 0.88 in January to 2.00 in May), Bridgewater picked up real momentum through the season: more homes for sale, and buyers moving faster to grab them.
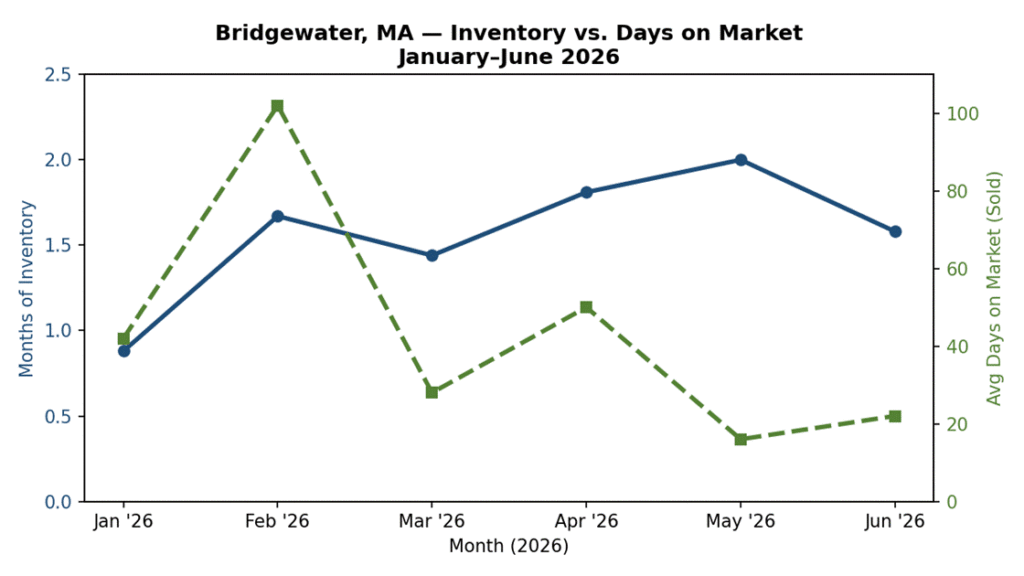
Bridgewater months of inventory (left axis) vs. average days on market for sold homes (right axis), Jan–Jun 2026.
Bridgewater vs. the State as a Whole
Massachusetts overall saw its statewide inventory nearly double between January and June 2026 (3,563 to 5,901 active listings) while the average sold-to-list ratio climbed from 98.58% to 101.23% — a state getting more competitive even as supply grew. Bridgewater’s own sold-to-list ratio followed a similar arc, closing June at 104.66%, well above the statewide figure and a sign that Bridgewater buyers were bidding up in-demand homes even more aggressively than the Massachusetts average.
What This Means If You’re Selling in Bridgewater
A market that’s both appreciating and moving faster is generally good news for sellers — but it also means timing your listing matters. A home priced off January or February comps could be leaving money on the table by summer, while a home that sits too long risks missing the faster-moving buyer pool altogether.
If you’d rather not gamble on timing the market, or if your home isn’t in a position to compete for top-of-market pricing without repairs or updates, there’s a more predictable path.
Sell Your Massachusetts House Fast!
We buy houses in Massachusetts in ANY CONDITION! Get a CASH offer with no commissions, agents, or hidden fees. Just enter your property address, phone, and email below, and you could receive your cash offer within 24 hours!
Thinking About Selling in Bridgewater?
Market data can tell you a lot about pricing and timing, but it can’t tell you what your specific house, your specific timeline, and your specific situation call for. If a slow-moving buyer pool, financing fall-throughs, or the thought of months of showings doesn’t sound appealing, there’s another option. Bluefin Property Buyers buys houses throughout Massachusetts in as-is condition, for cash, on a timeline that works for you — no repairs, no staging, no waiting on a buyer’s mortgage approval, and no commissions.
As we always say: Take the easy way out.
Curious what your Bridgewater property is really worth in cash, as-is, no obligation? Get your free cash offer for your Bridgewater home here, or see how these numbers compare across Massachusetts as a whole.
Are home prices rising in Bridgewater, MA in 2026?
Yes. The average sold price rose from $594,179 in January 2026 to $711,607 in June 2026, an increase of nearly 20% over the first half of the year.
How fast are homes selling in Bridgewater right now?
It depends on the month, but the trend through spring 2026 was toward faster sales — homes that sold in May 2026 averaged just 16 days on market, down from 65 days in May 2025, and June 2026 sold homes averaged 22 days versus 52 days in June 2025.
Is Bridgewater, MA a seller’s market in 2026?
Largely yes. Months of inventory stayed under 2.0 for five of the first six months of 2026, and the average sold-to-list ratio was above 100% in four of those six months, including 104.66% in June.
What is the average home sale price in Bridgewater, MA?
Through the first half of 2026, Bridgewater’s average sold price ranged from $594,179 in January to a high of $712,528 in April, with June closing at $711,607.
Should I sell my Bridgewater house now or wait?
With prices trending upward and inventory still relatively tight, current conditions have generally favored sellers. That said, market timing carries real risk, and a home that needs work may not capture top-of-market pricing without a renovation investment first. A direct cash sale removes that guesswork by locking in a price and closing date today, regardless of where the market goes next.