
July 2026 | MLSPIN Data Pulled 8/4/2026
| ACTIVE LISTINGS 30 -11.8% YoY | HOMES SOLD 22 +22.2% YoY | AVG SOLD PRICE $666,494 -1.5% YoY | MONTHS OF INVENTORY 1.67 vs. 2.13 last July |
July 2026 Snapshot
Bridgewater’s July 2026 data shows a town where more homes are selling, faster, for essentially the same money as a year ago – a sign of a healthy, active market rather than one running hot on price. Sales rose 22.2% year-over-year, from 18 homes in July 2025 to 22 this July, while the average sold price held essentially flat at $666,494 (down just 1.5% from $676,609). Active inventory tightened to 1.67 months of supply from 2.13 a year ago, even as the raw number of active listings fell to 30 from 34.
Year-Over-Year Comparison: July 2026 vs. July 2025
| Metric | July 2025 | July 2026 | YoY Change |
| Active Listings | 34 | 30 | -11.8% |
| Active Avg. List Price | $775,078 | $726,660 | -6.2% |
| Active Avg. Days on Market | 37 | 28 | -9 days |
| Homes Sold | 18 | 22 | +22.2% |
| Sold Avg. Days on Market | 20 | 39 | +19 days |
| Average Sold Price | $676,609 | $666,494 | -1.5% |
| Sold-to-List Ratio | 101.48% | 103.96% | +2.48 pts |
| Months of Inventory | 2.13 | 1.67 | -0.46 mo. |
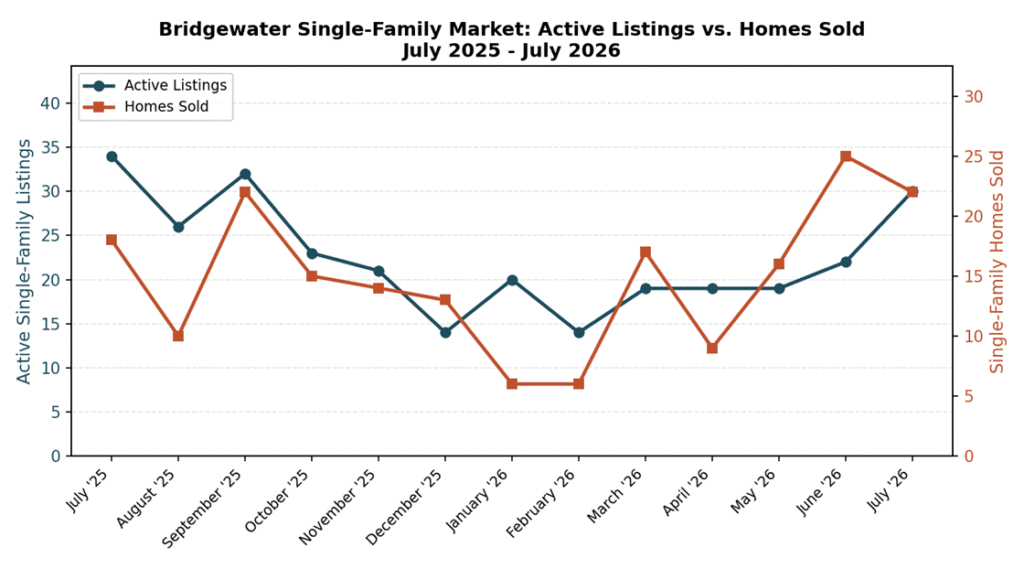
Chart: Bridgewater active listings vs. homes sold, July 2025-July 2026.
Trend: First Seven Months of 2026
The one figure worth flagging: sold homes averaged 39 days on market in July, nearly double last July’s 20 days. That’s a somewhat unusual combination alongside faster-moving active listings (28 days on market currently vs. 37 a year ago) and a higher sold-to-list ratio (103.96% vs. 101.48%) – it suggests a wider mix of homes closed in July 2026, including some that took longer to find the right buyer, even as the newest listings are attracting faster offers. Across the broader March-through-July stretch, Bridgewater sales were up sharply (89 homes vs. 69, a 29.0% increase) with average sold price up a more modest 3.6% – reinforcing that this is a volume story more than a price story right now.
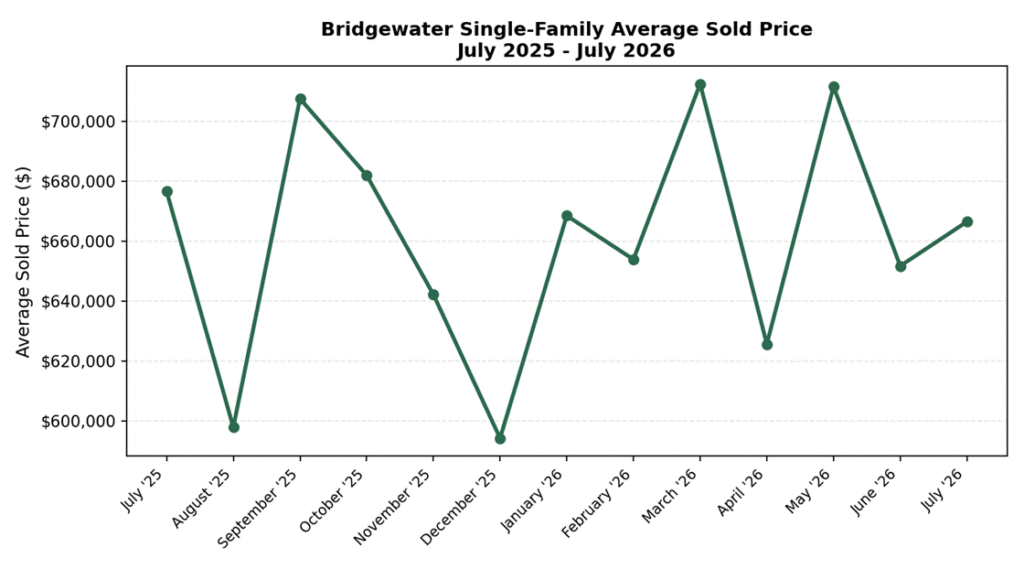
Chart: Bridgewater average single-family sold price by month, July 2025-July 2026.
What This Means If You’re Thinking About Selling
For Bridgewater sellers, that means competitive interest and quick action on well-priced homes, but not necessarily the kind of runaway price appreciation seen in some neighboring towns. If your home isn’t a fit for a traditional 20-to-39-day marketing timeline – because of condition, timeline pressure, or simply wanting certainty – Bluefin Property Buyers purchases Bridgewater homes directly for cash, as-is. Find out more at We Buy Houses for Cash in Bridgewater MA page and take the easy way out.
Frequently Asked Questions (FAQs)
What is the average home price in Bridgewater, MA in 2026?
Bridgewater’s average single-family sold price was $666,494 in July 2026, essentially flat (-1.5%) compared to $676,609 in July 2025.
Is Bridgewater, MA a good market to sell a house in 2026?
Sales volume is up 22.2% year-over-year and inventory has tightened to 1.67 months of supply, making it a reasonably active seller’s market, though price growth has been modest.
How long does it take to sell a house in Bridgewater, MA?
Homes that sold in Bridgewater in July 2026 averaged 39 days on market, up from 20 days in July 2025.
Are home prices rising in Bridgewater, Massachusetts?
Prices have been roughly flat year-over-year, though the March-July 2026 average sold price was up a modest 3.6% over the same period in 2025.
How much inventory is on the market in Bridgewater, MA?
Bridgewater had 30 active single-family listings in July 2026, representing about 1.67 months of supply.